Rocky Berndsen Featured in IAM Article: Covid Impact on US Patent Filings

A recent article by Angela Morris for IAM features patent data and insight from Rocky Berndsen, Head of the Harrity Patent Analytics Team. Using the annual Patent 300® report, Rocky provides reasoning for the apparent decline in patents from major players since the start of Covid.

“The slide in patent grants means something, according to Rocky Berndsen, head of patent analytics at Harrity & Harrity, which conducted the data analysis.

First, it could be indicative of changing prosecution patterns. ‘Thinking back, 2020 was the covid year. It was really when it started hitting and we all had the shut-downs. But some of the impact is showing in the 2021 data. We had a drop-off in 2021 as a result of what was happening in 2020. There is a lag that happens in the patent field with filings and prosecution budgets,’ explains Berndsen.”

Read the full article at HERE.

Learn more about our patent analytics capabilities by visiting the Harrity Analytics site HERE.

Business Methods Patents Are Alive & Well!

By Rocky Berndsen, Head of Harrity Patent Analytics

Business Method patents are alive and well! Here is a list of the top 25 companies that obtained patents in 2021 in the business method art units at the USPTO.

Surprisingly, this is one of the few areas where we see year over year growth in patenting. This increase in patenting may be due to the sea change that we’ve seen in how the USPTO has handled the prosecution of business method patents.

There is some interesting variation in the patent prosecution metrics for companies obtaining patents in this space. This list is a who’s who of high-technology and fin-tech companies.

I’m surprised to see that significant percentage of patents in this space that are con/div.

What do you think? Find me on Linkedin and let me know your thoughts!

Want to see more interesting patent analytics? Check out our newest Patent 300® list here!


About Harrity Patent Analytics

Harrity Patent Analytics, an analytical team within the boutique IP law firm of Harrity & Harrity, LLP, uses cutting-edge capabilities to analyze patent data and extract insights for clients to use when making strategic decisions regarding patent portfolios. Patent 300® companies rely on Harrity Patent Analytics services to understand their patent portfolios, the patent portfolios of their competitors, and patent office trends around the world. For more information, visit harrityllp.com/services/patent-analytics/.


Comparing Auto Manufacturer’s Patent Data to Sales, Revenues, and R&D

By Rocky Berndsen, Head of Harrity Patent Analytics


One of my favorite ways to look at patent data is by comparing the data to sales, revenues, and R&D. Here are the top Auto Manufacturers that obtained patents in the US. I’ve included data from our patent database, and from www.goodcarbadcar.com.

This stat is interesting – Cars Sold to Patents. There could be a couple of insights drawn from this stat.

Here are some of my thoughts:
1. How much does a company value patenting – a higher ratio may indicate that the company places less value on patenting.
2. How much are patents playing in driving sales – a lower ratio may indicate that patents play a bigger role in driving sales
3. Which companies are innovating the most in the space relative to market size – using cars sold to normalize the quantity of patents provides a more direct benchmark.

Connect with me on Linkedin and let me know your thoughts on this statistic and what other kinds of stats you’d find interesting.

You can find more patent data on the top companies by viewing our Patent 300® List HERE.


About Harrity Patent Analytics

Harrity Patent Analytics, an analytical team within the boutique IP law firm of Harrity & Harrity, LLP, uses cutting-edge capabilities to analyze patent data and extract insights for clients to use when making strategic decisions regarding patent portfolios. Patent 300® companies rely on Harrity Patent Analytics services to understand their patent portfolios, the patent portfolios of their competitors, and patent office trends around the world. For more information, visit harrityllp.com/services/patent-analytics/.


Harrity Analytics Announces Top Patent Firms of 2021

HARRITY PATENT ANALYTICS ANNOUNCES THE TOP PATENT FIRMS OF 2021

WASHINGTON (January 20, 2022) –  Harrity Patent Analytics is excited to announce the Top Patent Firms of 2021. The list, published annually, ranks industry-leading patent law firms based on the total number of U.S. utility patents issued in the past year.

The 2021 Top Patent Firms list incorporates multiple categories of prosecution statistics, including 7 new categories, such as rank in US First Filings and rank in Foreign Priority Filings.

Fish & Richardson surpasses Oblon for the first time in list history, taking the #1 spot in both overall and US first filings. Other notable changes on the list include Kilpatrick Townsend dropping from the #7 spot to #11, and Foley & Lardner moving up from #8 to #5.  Some newcomers to the list in 2021 include Kacvinsky Daisak Bluni at #109, and Fig. 1 Patents at #282.

The Top 10 firms of 2021 in overall utility patents are:

  1. Fish & Richardson P.C. (5025)
  2. Oblon McClelland Maier & Neustadt LLP (4620)
  3. Sughrue Mion PLC (4398)
  4. Cantor Colburn LLP (3652)
  5. Foley & Lardner LLP (3416)
  6. Oliff PLC (3297)
  7. Birch Stewart Kolach & Birch LLP (3250)
  8. Knobbe Martens Olson & Bear LLP (3014)
  9. Shwegman Lundberg & Woessner P.A. (2995)
  10. Harness Dickey & Pierce PLC (2963)


“The differences on this year’s Top Patent Firm rankings align with what we saw on the Patent 300®, with big companies filing less patents than in previous years, and therefore the law firms doing their work obtaining less patents – likely due to budgetary restraints imposed by the ongoing pandemic. The list demonstrates which patent firms are still big players, while providing insight for both clients and firms to make strategic decisions moving forward,” states Rocky Berndsen, Head of Harrity Patent Analytics.

The Top Patent Firms list is accompanied by an interactive dashboard and includes patent firms that have obtained at least 50 U.S. utility patents where the patent firms are listed on the front of the utility patents. Company legal departments have not been eliminated from the list.  The full list is available here.

About Harrity Patent Analytics

Harrity Patent Analytics, an analytical team within the boutique IP law firm of Harrity & Harrity, LLP, uses cutting-edge capabilities to analyze patent data and extract insights for clients to use when making strategic decisions regarding patent portfolios. Patent 300® companies rely on Harrity Patent Analytics services to understand their patent portfolios, the patent portfolios of their competitors, and patent office trends around the world. For more information, visit harrityllp.com/services/patent-analytics/.

###

Harrity Analytics Releases 2022 Design Patent 100 List

HARRITY PATENT ANALYTICS RELEASES THE 2022 DESIGN PATENT 100 LIST

List ranks top 100 companies, organizations, and universities in the design patent field

WASHINGTON (January 11, 2022) – Harrity Patent Analytics has released the 2022 publication of its annual Design Patent 100 List.  The list ranks the top 100 companies, organizations and universities in the patent field based on the total number of U.S. design patents issued in the past year.  The top 10 innovators from the 2022 Design Patent 100 List include:

  1. Samsung (615)
  2. Nike (541)
  3. Apple (438)
  4. LG (220)
  5. Ford (210)
  6. Alphabet (209)
  7. MASCO Corporation (194)
  8. Tata Sons (159)
  9. Porsche (152)
  10. P&G (141)

Samsung Electronics surpassed Nike to take the #1 spot, with a 4% increase from last year. Nike dropped to the #2 position with a 22% decrease from last year.  Overall, this year’s Top 10 saw an average 1% decrease from the previous year.  Other notable changes include MASCO Corporation’s debut to the Top 10, ranking 7th with a 59% increase, and Spigen Inc, dropping off the Top 10 to #12, with a 46% decrease. Bissell Homecare had the largest increase in design patents since 2020, at 1500%.

“The Design Patent 100 List identifies the global innovation leaders obtaining design patents in the United States,” said Rocky Berndsen, Head of Analytics for Harrity & Harrity. “The data contained in the Patent 300® Dashboard, such as the Design Patent 100 List, provides invaluable information to companies, in-house counsel, marketing teams, and law firms alike because it identifies the key players in design innovation and summarizes what is happening today in the patent world.”

For detailed analytics on the Design Patent 100, visit Harrity’s Patent 300® Dashboard, the intellectual property industry’s premier resource for patent insights and competitive intelligence on the world’s leaders in technology and design innovation.  The Dashboard contains analytics on more than 6,000,000 patents, including patent portfolio analyses, detailed patent prosecution insights, technology area breakdowns, and portfolio cost and budget analytics.

About Harrity Patent Analytics

Harrity Patent Analytics, an analytical team within the boutique IP law firm of Harrity & Harrity, LLP, uses cutting-edge capabilities to analyze patent data and extract insights for clients to use when making strategic decisions regarding patent portfolios. Patent 300® companies rely on Harrity Patent Analytics services to understand their patent portfolios, the patent portfolios of their competitors, and patent office trends around the world. For more information, visit harrityllp.com/services/patent-analytics/.

###

A Look at Patent 300® Companies’ Office Actions Per Patent

HARRITY PATENT ANALYTICS: A LOOK AT PATENT 300® COMPANIES’ OFFICE ACTIONS PER PATENT

By Rocky Berndsen, Head of Harrity Analytics

One of the stats I find most interesting in the patent field is the office action per patent statistic. There can be so many reasons why this statistic could vary so greatly from company to company. Here are a few of my ideas on the factors that go into it.

1. Filing strategy / Claim breadth – some filers will fight tooth and nail for every claim, whereas, other filers are just trying to get to allowance as quickly as possible.

2. Technology area – some technology areas may be more difficult to get patents in for a number of reasons (e.g., quality prior art, large numbers of filings, patentability issues).

3. Prosecution quality – the quality of prosecution quality varies from firm to firm, and even from attorney to attorney.

4. Foreign priority – apps with foreign priority tend to have fewer office actions per patent and typically will have fewer claims.

5. Budget/Cost consideration – prosecution strategy may be impacted by budget and therefore applications that reach higher numbers of office actions or RCEs may be abandoned.

6. Continuation strategy – continuation filings will tend to have fewer office actions than original priority filings.

Below, you can see the Patent 300® Companies with the highest and lowest office actions per patent.

I’d love to hear if you have any additional thoughts on the factors that go into these OA statistics.

The official 2022 ranking of the top 300 companies, organizations and universities can be found here. You can find more information regarding prosecution statistics in the interactive Patent 300® Dashboard here.


About Harrity Patent Analytics

Harrity Patent Analytics, an analytical team within the boutique IP law firm of Harrity & Harrity, LLP, uses cutting-edge capabilities to analyze patent data and extract insights for clients to use when making strategic decisions regarding patent portfolios. Patent 300® companies rely on Harrity Patent Analytics services to understand their patent portfolios, the patent portfolios of their competitors, and patent office trends around the world. For more information, visit harrityllp.com/services/patent-analytics/.


Law 360: IBM, Samsung Keep Top Spots On Annual Patent 300® List

Law360 publishes report based on Harrity Analytic’s annual Patent 300® List.

Law360 (January 6, 2022, 7:42 PM EST) — IBM Corp. maintained its long-running status as the top patent owner in 2021 while Samsung clocked in close behind, but patent grants to companies that notched a spot on the list highlighting the top 300 patent owners released Thursday were largely down…

Rocky Berndsen, head of patent analytics at Harrity & Harrity, told Law360 in an interview that the drops in patent grants in 2021 can be partly attributed to budget considerations spurred by the pandemic.

“Anecdotally, what we can see from this year’s list is that some companies have been more strategic with what patent applications they continued to prosecute in light of those budget considerations,” Berndsen said. “Maybe last year, or the year before, they would’ve filed or prosecuted more applications. But they decided to drop some, and so we’re seeing the results of that in this year’s list.”

But there were some companies that landed on the list for the first time, including JPMorgan Chase & Co. at 275. Berndsen said that reflects growth happening in the fintech world.

“There’s a lot of technology development in fintech, and we’re seeing a lot of that with a company like JPMorgan Chase making the list for the first time this year,” he said.

Read the full Law360 report by Britain Eakin here.


About Harrity Patent Analytics

Harrity Patent Analytics, an analytical team within the boutique IP law firm of Harrity & Harrity, LLP, uses cutting-edge capabilities to analyze patent data and extract insights for clients to use when making strategic decisions regarding patent portfolios. Patent 300® companies rely on Harrity Patent Analytics services to understand their patent portfolios, the patent portfolios of their competitors, and patent office trends around the world. For more information, visit harrityllp.com/services/patent-analytics/.


Harrity Analytics Releases 2022 Patent 300® List

HARRITY PATENT ANALYTICS RELEASES THE 2022 PATENT 300® LIST

Top 300 innovators in the patent field ranked by patents obtained

WASHINGTON (January 6, 2022) – Harrity Patent Analytics is excited to announce the release the 2022 Patent 300® List.  The annual list ranks the top 300 companies, organizations and universities in the patent field based on the total number of U.S. utility patents issued in the past twelve months.  The top 20 players from the newly published Patent 300® List include:

  1. IBM (8540)
  2. Samsung Electronics (8517)
  3. LG Corporation (4388)
  4. Canon (3400)
  5. Huawei (2955)
  6. Intel (2835)
  7. TSMC (2807)
  8. Toyota (2753)
  9. Raytheon Technologies (2694)
  10. Sony (2624)
  11. Apple (2591)
  12. Microsoft (2453)
  13. Qualcomm (2165)
  14. BOE Technology (2141)
  15. Amazon (2110)
  16. Dell Technologies (2053)
  17. Alphabet (2015)
  18. Micron (1798)
  19. Panasonic (1715)
  20. Ford (1675)


IBM maintains the top spot in the list despite a significant drop in total patents with their spin-off of Kyndryl.  Notably, TSMC, Qualcomm, and Micron moved up the list, whereas Microsoft and Raytheon Technologies moved lower.  The biggest overall change in the list is the fact that total patents obtained by the Patent 300® was 22,358 fewer in 2021 than in 2020.  The list accounts for 54 percent of the more than 340,000 U.S. patents issued in 2021.

“The Patent 300® list, year after year, provides a barometer for the most innovative companies in the world”, says Rocky Berndsen, Head of Patent Analytics at Harrity & Harrity.  “You can really see who is innovating in dozens of different industries and also see who the up-and-coming technology companies are”.

Harrity Patent Analytics additionally offers the Patent 300® Dashboard for more detailed analytics on the Patent 300® List.  The dashboard is the intellectual property industry’s premier resource for patent insights and competitive intelligence on the world’s leaders in technology, containing analytics on more than 6,000,000 patents, including patent portfolio analyses, detailed patent prosecution insights, technology area breakdowns, and portfolio cost and budget analytics.

The Patent 300® Dashboard provides in-house counsel, law firm partners, marketing teams, and c-suite executives with a detailed analysis of the world’s technology leaders, ranging from technology giants such as IBM (ranked #1) and Samsung (ranked #2), to leading universities such as MIT (ranked #108) and Johns Hopkins University (ranked #276), to newcomers including Kyndryl (ranked #117) and Snowflake (ranked #276).

The official 2022 ranking of the top 300 companies, organizations and universities can be found here.


About Harrity Patent Analytics

Harrity Patent Analytics, an analytical team within the boutique IP law firm of Harrity & Harrity, LLP, uses cutting-edge capabilities to analyze patent data and extract insights for clients to use when making strategic decisions regarding patent portfolios. Patent 300® companies rely on Harrity Patent Analytics services to understand their patent portfolios, the patent portfolios of their competitors, and patent office trends around the world. For more information, visit harrityllp.com/services/patent-analytics/.


Harrity Analytics Provides Patent Data on Medical Diagnostics for IAM

Harrity Analytics provides patent data relating to medical diagnostics for IAM to gain an understanding of how Mayo vs Prometheus has impacted applications and grants.

“Analysis of patent data hints that the Supreme Court’s Mayo decision may not have had a big impact on medical diagnostics patenting rates, but change in filing behaviours could be delayed…”

Read the full article by Bridget Diakun here

Looking for specific patent data? Harrity Analytics is available for custom projects! Click here to get started.


Getting To Know Your Patent Examiner Through Data

Law360 (June 13, 2019) — How many office actions should I expect at the U.S. Patent and Trademark Office? Should I file a request for continued examination or a notice of appeal? Is it worth filing a pre-appeal?

These, among others, are common questions that practitioners may ask themselves during patent prosecution. In the past, these were mostly questions that could not be answered by taking into account unique proclivities of different examiners. Now, using data analytics, we can get a better sense of how prosecution will go and be able to make an informed decision when a crossroad is reached.

Below, we will explore how to use public data about an examiner, provided by the USPTO, during patent prosecution.

Allowance Rate

By looking at an examiner’s allowance rate (i.e., allowance vs. abandonments), we can get a sense of the journey early on. A high allowance rate is an indicator that the examiner likely has no qualms about allowing applications, and that the examiner likely will not stubbornly stick to poor rejections. For these types of examiners, if appropriate, it may be worth taking a more assertive initial position, including arguing that the rejections should be withdrawn, or offering modest amendments.

However, if the examiner’s allowance rate is low, you may want to consider including substantial amendments or anticipate the possible need to file an appeal as these types of examiners tend to combine three, four, or even five-plus references in their art rejections. If the allowance rate in the art unit is significantly higher than the examiner’s allowance rate, you may want to consider getting the examiner’s supervisor or a primary examiner in the art unit involved early in the process as it may be easier to reach an agreement with them than with the assigned examiner.

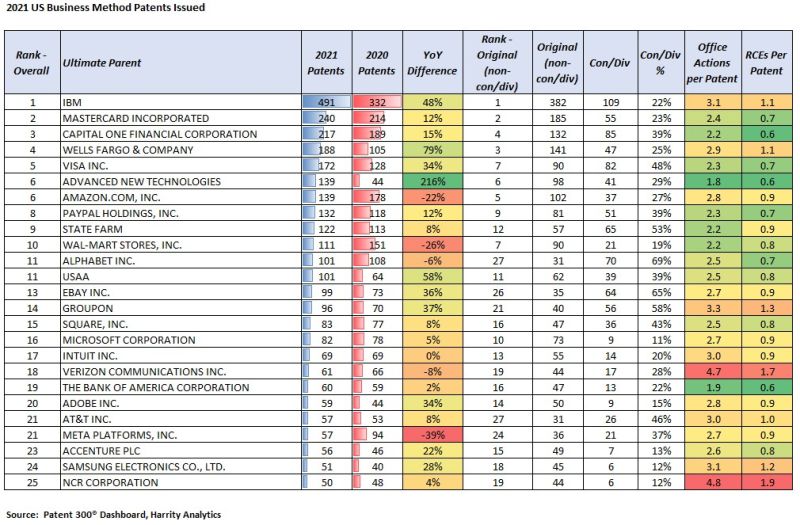
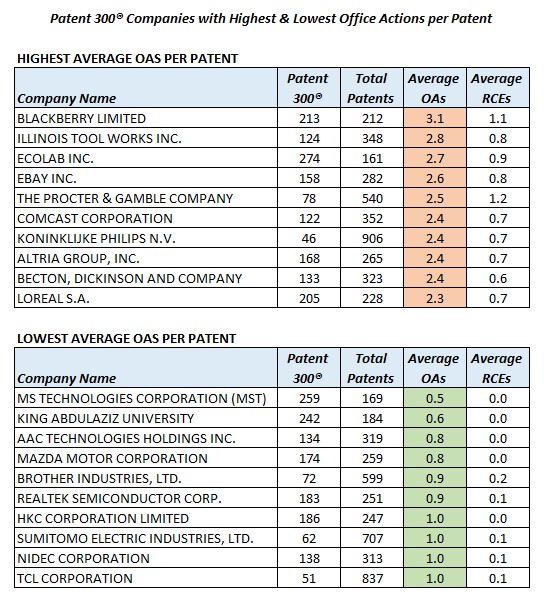
Office Actions Per Patent, RCEs Per Patent

A high office action per patent and/or RCE per patent rate may be an indication that reaching allowability will be challenging. These types of examiners also are likely unafraid to combine three, four or five-plus references to make their art rejections. Similar to examiners with low allowance rates, you may want to consider including substantial amendments, getting the supervisory examiner or a primary examiner involved, or planning to file an appeal. You may even want to check the supervisory examiner’s and primary examiner’s allowance rates when deciding whether to get one of them involved.

Interview Statistics

Generally speaking, it is beneficial to interview an examiner as it gives a practitioner an opportunity to get a better sense of the examiner’s interpretations of the application and the applied references, and a chance to explain the invention.

A high interview success rate (i.e. the rate that interviews lead to an allowance in the next office action) may be an indicator that the examiner uses interviews for compact prosecution. These examiners are likely willing to provide suggestions for amendments that would lead to allowance or at least advance prosecution. For these types of examiners, you may want to be prepared to discuss multiple, different types of amendments to take advantage of their willingness to expedite prosecution. However, if the interview success rate is low for the examiner, consider sending a substantive interview agenda with proposed amendments to maximize the chance of reaching an agreement with the examiner.

A comparison of an examiner’s final rejection allowance rate with After Final Consideration Pilot and his/her final rejection allowance rate without AFCP may be an indicator of whether the examiner takes the AFCP program seriously. If there is a significant difference with those rates, the examiner likely uses the allocated two to three hours in the AFCP program to find a way to allow the application. For these types of examiners, consider filing an after-final amendment with an AFCP request before deciding whether to file an RCE or a notice of appeal. However, if the rates are similar, the examiner likely uses pre-pilot procedures regardless of whether an AFCP is filed.

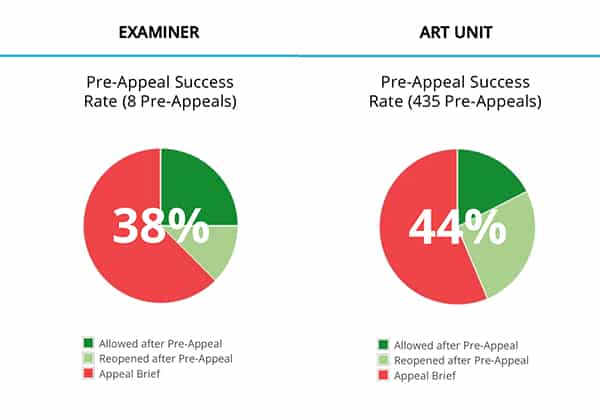
Pre-Appeal Statistics

Pre-appeal statistics can be useful when deciding whether to file an appeal brief or a pre-appeal brief. A high rate of allowance and/or re-opening of prosecution when pre-appeals are filed may indicate that the examiner, the examiner’s SPE, and other panel members in the examiner’s art unit take the pre-appeals process seriously and that it is worth presenting arguments in a pre-appeal brief. However, a low rate of allowance and a low rate of reopening of prosecution after pre-appeal may indicate that it would be better to forego the pre-appeal process and go straight to appeal or go another round with an RCE.

Appeal Statistics

Analyzing an examiner’s appeal statistics may be useful in determining whether to file an appeal or an RCE. If the examiner’s rate of allowance after an appeal is filed is high, it may be worth appealing rather than filing an RCE and avoid narrowing claims unnecessarily. However, if the examiner’s rate of allowance after appeal is low, it is highly likely that your appeal will go to the Patent Trial and Appeal Board.

Since it may take a couple of years for the PTAB to pick up your appeal due to their backlog, you may want to make certain that your client is comfortable with going through with the appeals process and waiting rather than filing an RCE and possibly reaching an agreement with the examiner earlier. For these types of examiners, you may want to consider the examiner’s allowance rate and RCEs per patent rate to help you and your client in making this decision.

If the examiner’s board decision success rate is high, it may be an indication that the examiner goes to the board only when he/she believes that his/her examiner’s answer would be particularly strong. If you receive a compelling examiner’s answer from these types of examiners, consider filing an RCE rather than going to the board.

Conclusion

Just like how data analytics has improved efficiency in other industries, examiner analytics has the potential to improve the efficiency of patent practitioners and patent prosecution. Therefore, using examiner data in your practice may lead to better, quicker and cheaper outcomes for you clients.

By Kris Rhu

The example screenshots in this article are from Patentprufer, which was developed by Harrity & Harrity.