Semiconductors and Memory Ranks as the #1 Technology Area in the 2019 Patent 300™ Report
By Rocky Berndsen
The 2019 Patent 300™ Report details the top 300 companies, organizations, and universities obtaining patents in the United States. Data from the report shows that nearly 70% of the U.S. patents obtained in 2018 were for electrical, software, or computer-related technologies. The top 10 technology areas, which represent 49% of the 167,164 U.S. patents obtained by Patent 300 companies in 2018, are dominated by electrical technologies.
Chart 1 shows the Semiconductors and Memory technology area ranked highest in 2018. There were 15,153 patents issued for Patent 300 companies in the U.S. Semiconductors and Memory technology covers multiple United States Patent & Trademark Office (USPTO) technology classifications. Included are processes for manufacturing semiconductors and solid-state devices. Also included are processes and apparatus for addressing, accessing and controlling, and forming memory addresses in a computer or digital data processing system.
Chart 1 – Top 10 Technology Areas for Patent 300 (2018 U.S. Patents)
| Rank | Patent 300 Technology Area | 2018 U.S. Patents | Percentage of Total 2018 U.S. Patents |
|---|---|---|---|
| 1 | Semiconductors/Memory | 15,153 | 9% |
| 2 | Electrical Circuits and Systems | 13,215 | 8% |
| 3 | Multiplex and VoIP | 9,875 | 6% |
| 4 | Optics | 9,003 | 5% |
| 5 | Printing/Measuring and Testing | 8,641 | 5% |
| 6 | Thermal & Combustion Technology, Motive & Fluid Power Systems | 7,017 | 4% |
| 7 | Selective Visual Display Systems | 4,855 | 3% |
| 8 | Telecommunications: Analog Radio Telephone; Satellite and Power Control; Transceivers, Measuring and Testing; Bluetooth; Receivers and Transmitters; Equipment Details | 4,761 | 3% |
| 9 | Computer Networks | 4,544 | 3% |
| 10 | Cryptography and Security | 4,311 | 3% |
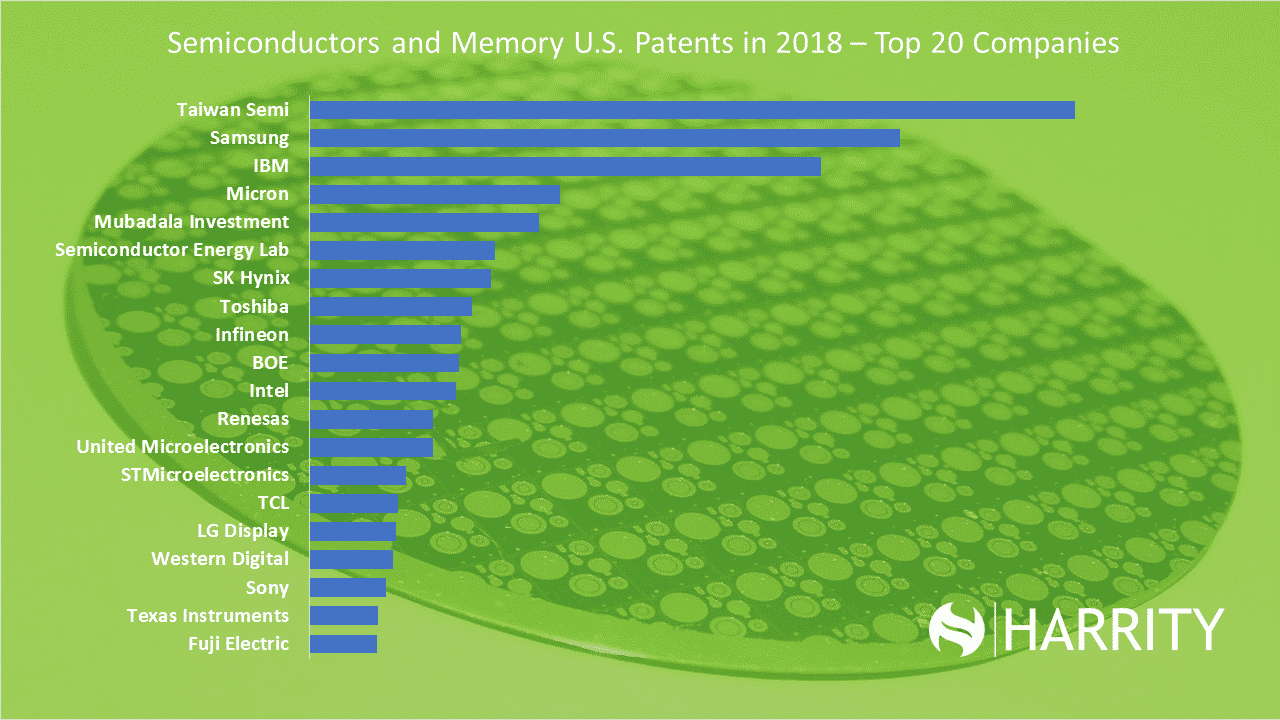
The top 20 companies in the Semiconductors and Memory area, shown in Chart 2, include Taiwan Semiconductor (#1), Samsung (#2), IBM (#3), Micron (#4), and others. Taiwan Semiconductor tops the list having obtained 1,972 U.S. patents, up slightly from 2017. Samsung had 1,522 U.S. patents, down nearly 15% from 2017. IBM, at 1,318, was up slightly from 2017. The top 20 companies represent a cross-section of the technology sector. Included are chip makers, device makers, and various electronics companies.
Chart 2 – Top 20 Companies by U.S. Patents in Semiconductors and Memory
| Patent 300 Company Name | Patent 300 Rank in Semiconductors and Memory | Semiconductor and Memory Patents 2018 | % of Company’s 2018 U.S. Patents | Semiconductor and Memory Patents 2017 | Change from 2017 Patents |
|---|---|---|---|---|---|
| Taiwan Semiconductor | 1 | 1972 | 79% | 1893 | 4% |
| Samsung | 2 | 1522 | 19% | 1744 | -15% |
| IBM | 3 | 1318 | 14% | 1271 | 4% |
| Micron | 4 | 645 | 69% | 556 | 14% |
| Mubadala Investment | 5 | 593 | 72% | 687 | -16% |
| Semiconductor Energy Lab | 6 | 478 | 55% | 587 | -23% |
| SK Hynix | 7 | 468 | 58% | 652 | -39% |
| Toshiba Memory | 8 | 419 | 60% | 468 | -12% |
| Infineon | 9 | 392 | 45% | 505 | -29% |
| BOE | 10 | 387 | 24% | 451 | -17% |
| Intel | 11 | 377 | 11% | 481 | -28% |
| Renesas | 12 | 320 | 55% | 365 | -14% |
| United Microelectronics | 13 | 318 | 93% | 326 | -3% |
| STMicroelectronics | 14 | 249 | 35% | 228 | 8% |
| TCL | 15 | 230 | 24% | 167 | 27% |
| LG Display | 16 | 224 | 33% | 216 | 4% |
| Western Digital | 17 | 215 | 29% | 330 | -53% |
| Sony | 18 | 197 | 9% | 184 | 7% |
| Texas Instruments | 19 | 178 | 22% | 212 | -19% |
| Fuji Electric | 20 | 176 | 52% | 128 | 27% |
For more detailed information about this technology area, or any other data related to the 2019 Patent 300™ Report, please visit harrityllp.com/patent300/ or contact Rocky Berndsen directly via email at rberndsen@harrityllp.com.