Cryptography and Security Ranks as the #9 Technology Area in the 2020 Patent 300®
The 2020 Patent 300® details the top 300 companies, organizations, and universities obtaining patents in the United States. Data from the report shows that nearly 56% of patents obtained in the U.S. in 2019 were by Patent 300® companies. The top 10 technology areas, which represent 47% of the 189,796 U.S. patents obtained by Patent 300® companies in 2019, are again dominated by electrical technologies.
As shown in Chart 1, the Cryptography and Security technology area was the 9th largest technology area in 2019 with 5,016 patents issued for Patent 300® companies in the U.S. The Cryptography and Security technology area covers United States Patent & Trademark Office (USPTO) technology classifications related to secure communications and information security.
Chart 1 – Top 10 Technology Areas for Patent 300® (2019 U.S. Patents)
| Rank | Patent 300 Technology Area | 2019 U.S. Patents | Percentage of Total 2019 U.S. Patents |
|---|---|---|---|
| 1 | Semiconductors/Memory | 15841 | 8% |
| 2 | Electrical Circuits and Systems | 14269 | 8% |
| 3 | Multiplex and VoIP | 10824 | 6% |
| 4 | Printing/Measuring and Testing | 10383 | 6% |
| 5 | Optics | 9830 | 5% |
| 6 | Selective Visual Display Systems | 7338 | 4% |
| 7 | Thermal & Combustion Technology, Motive & Fluid Power Systems | 5951 | 3% |
| 8 | Computer Networks | 5753 | 3% |
| 9 | Cryptography and Security | 5016 | 3% |
| 10 | Telecommunications | 4714 | 2% |
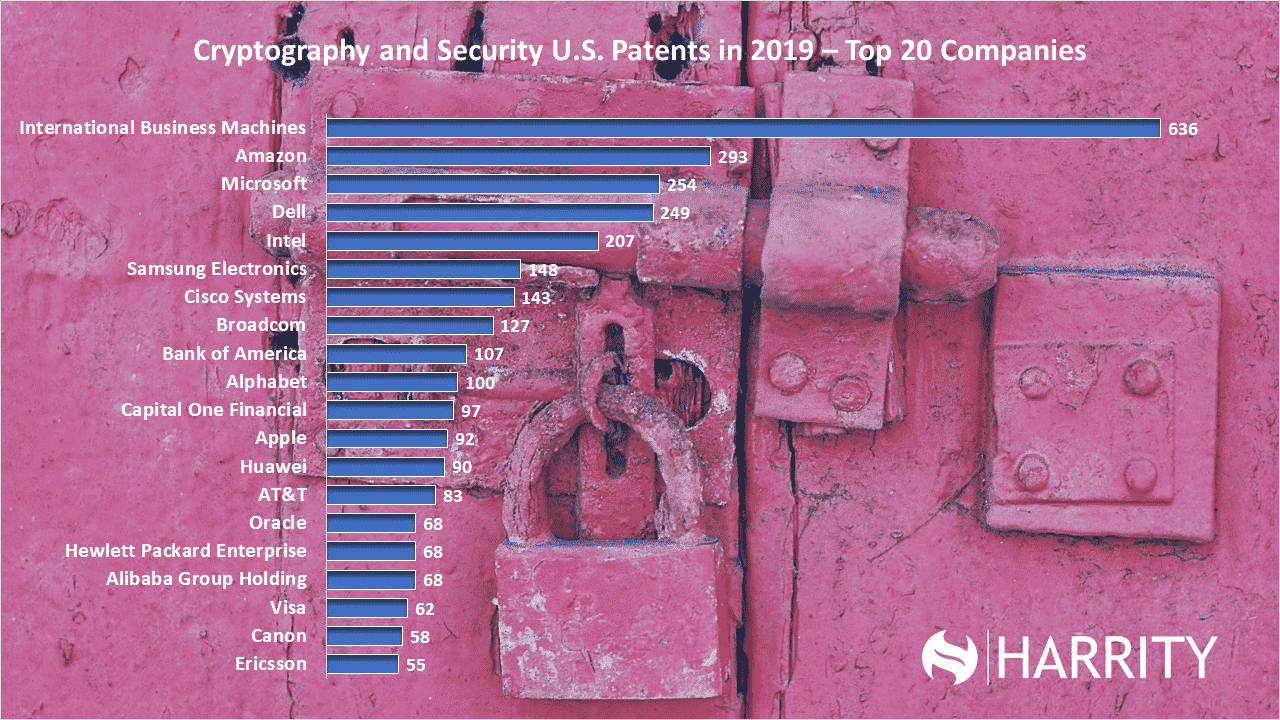
Many of the top 20 companies obtaining patents in the Cryptography and Security technology area, as shown in Chart 2, are large technology companies such as IBM (#1), Amazon (#2), Microsoft (#3), and Dell (#4). IBM maintains its strong lead in the list having obtained 636 U.S. patents in the Cryptography and Security technology area, despite a 2% decrease from 2018. Capital One (#11) is on the move in the Cryptography and Security technology space with 97 patents in 2019, a 646% increase from 2018.
Chart 2 – Top 20 Companies by U.S. Patents in Cryptography and Security
| Rank | Patent 300® | 2019 Cryptography Patents | % of Company's 2019 US Patents | 2018 Cryptography Patents | Change from 2018 |
|---|---|---|---|---|---|
| 1 | International Business Machines | 636 | 7% | 647 | -2% |
| 2 | Amazon | 293 | 12% | 252 | 16% |
| 3 | Microsoft | 254 | 8% | 199 | 28% |
| 4 | Dell | 249 | 10% | 257 | -3% |
| 5 | Intel | 207 | 6% | 219 | -5% |
| 6 | Samsung Electronics | 148 | 2% | 123 | 20% |
| 7 | Cisco Systems | 143 | 14% | 110 | 30% |
| 8 | Broadcom | 127 | 21% | 45 | 182% |
| 9 | Bank of America | 107 | 26% | 89 | 20% |
| 10 | Alphabet | 100 | 4% | 119 | -16% |
| 11 | Capital One Financial | 97 | 16% | 13 | 646% |
| 12 | Apple | 92 | 4% | 73 | 26% |
| 13 | Huawei | 90 | 3% | 56 | 61% |
| 14 | AT&T | 83 | 6% | 83 | 0% |
| 15 | Alibaba Group Holding | 68 | 22% | 30 | 127% |
| 15 | Hewlett Packard Enterprise | 68 | 8% | 29 | 134% |
| 15 | Oracle | 68 | 8% | 57 | 19% |
| 18 | Visa | 62 | 26% | 43 | 44% |
| 19 | Canon | 58 | 1% | 47 | 23% |
| 20 | Ericsson | 55 | 3% | 47 | 17% |
For more detailed information about this technology area, or any other data related to the 2020 Patent 300®, please visit harrityllp.com/patent300/.