


Harrity Analytics is proud to present The 2024 Design Patent 100. The Design Patent 100 is an annual compilation of the top 100 companies, organizations, and universities in the design patent field, based on the quantity of issued U.S. design patents each year.
| RANK | OWNER | 2023 US DESIGN PATENTS | CHANGE FROM 2023 |
|---|---|---|---|
| 1 | NIKE, INC. | 838 | 22% |
| 2 | SAMSUNG ELECTRONICS CO., LTD. | 454 | -14% |
| 3 | APPLE INC. | 378 | -27% |
| 4 | LG CORPORATION | 316 | -42% |
| 5 | THE SWATCH GROUP LTD | 167 | -1% |
| 6 | FORD MOTOR COMPANY | 162 | 50% |
| 7 | THE PROCTER & GAMBLE COMPANY | 160 | 7% |
| 8 | ALPHABET INC. | 150 | -29% |
| 9 | MASCO CORPORATION | 141 | -39% |
| 9 | HYUNDAI MOTOR COMPANY | 141 | 0% |
| 11 | GENERAL MOTORS COMPANY | 121 | -7% |
| 12 | PORSCHE AUTOMOBIL HOLDING SE | 120 | 50% |
| 13 | TATA SONS LTD | 118 | 20% |
| 14 | COMPAGNIE FINANCIÈRE RICHEMONT SA | 95 | 38% |
| 15 | AMAZON.COM, INC. | 94 | -19% |
| 16 | COPLUS INC | 77 | 413% |
| 17 | THE GOODYEAR TIRE & RUBBER COMPANY | 71 | 31% |
| 17 | XIAOMI INC. | 71 | -43% |
| 17 | JAPAN AVIATION ELECTRONICS INDUSTRY, LTD. | 71 | 73% |
| 20 | TOYOTA JIDOSHA K.K. | 70 | 56% |
| 20 | JOHNSON & JOHNSON | 70 | -5% |
| 22 | ARISTOCRAT LEISURE LIMITED | 67 | 8% |
| 23 | BRIDGESTONE CORPORATION | 66 | 78% |
| 24 | THE MERCEDES-BENZ GROUP AG | 64 | 42% |
| 25 | AB VOLVO | 63 | 54% |
| 26 | ZHEJIANG GEELY HOLDING GROUP | 62 | 100% |
| 27 | SUMITOMO RUBBER INDUSTRIES, LTD. | 60 | 94% |
| 28 | BAYERISCHE MOTOREN WERKE AG | 59 | -6% |
| 29 | HELEN OF TROY LIMITED | 58 | 7% |
| 29 | STELLANTIS N.V. | 58 | -2% |
| 31 | CANON K.K. | 57 | -26% |
| 32 | LUTRON ELECTRONICS COMPANY | 56 | 0% |
| 32 | CONAIR CORPORATION | 56 | 30% |
| 34 | HONDA MOTOR COMPANY, LTD. | 55 | 57% |
| 34 | KOHLER CO. | 55 | -19% |
| 34 | MITSUBISHI ELECTRIC CORPORATION | 55 | -31% |
| 34 | SKECHERS U.S.A., INC. II | 55 | 511% |
| 38 | STRYKER CORPORATION | 53 | 47% |
| 39 | YETI HOLDINGS | 52 | -21% |
| 40 | CJ CHEILJEDANG | 51 | 122% |
| 40 | SHARKNINJA | 51 | 42% |
| 42 | HADLEY, REBECCA | 49 | 14% |
| 42 | FUJIFILM HOLDINGS CORP | 49 | -32% |
| 44 | SPIGEN INC | 48 | 336% |
| 45 | SIEMENS AG | 47 | 7% |
| 46 | KONINKLIJKE PHILIPS N.V. | 46 | -39% |
| 46 | TECHTRONIC INDUSTRIES COMPANY LIMITED | 46 | -4% |
| 48 | WOLVERINE WORLD WIDE, INC. | 45 | 114% |
| 49 | HUAWEI TECHNOLOGIES CO., LTD. | 44 | 2% |
| 49 | PANASONIC CORPORATION | 44 | -25% |
| 51 | WHIRLPOOL CORPORATION | 42 | -29% |
| 51 | AUTEL INTELLIGENT TECHNOLOGY CORP., LTD. | 42 | -13% |
| 53 | HERMES SELLIER (SOCIÉTÉ PAR ACTIONS SIMPLIFIÉE) | 41 | 24% |
| 54 | TARGET CORPORATION | 40 | -35% |
| 54 | ACUSHNET HOLDINGS CORP. | 40 | 54% |
| 54 | RH (RESTORATION HARDWARE) | 40 | 208% |
| 57 | THERABODY, INC. | 39 | 105% |
| 57 | THE HEWLETT-PACKARD COMPANY (HP INC.) | 39 | 22% |
| 59 | LOGITECH INTERNATIONAL S.A. | 38 | 6% |
| 59 | KARSTEN MANUFACTURING CORP. | 38 | 23% |
| 61 | TIANJIN WANDA TYRE CO., LTD. | 37 | 1133% |
| 62 | ROBERT BOSCH GMBH | 36 | -22% |
| 63 | WONDERLAND SWITZERLAND AG | 34 | 26% |
| 63 | PARSONS XTREME GOLF | 34 | -59% |
| 65 | PACCAR INC | 33 | -35% |
| 65 | MICROSOFT CORPORATION | 33 | -11% |
| 65 | HUNTER FAN | 33 | -55% |
| 65 | ASPIRE NORTH AMERICA LLC | 33 | 43% |
| 65 | MEDLINE INDUSTRIES, INC. | 33 | 94% |
| 65 | HONEYWELL INTERNATIONAL INC. | 33 | 0% |
| 65 | MIDEA GROUP CO., LTD. | 33 | -61% |
| 72 | MICROTECH KNIVES, INC. | 32 | 3100% |
| 72 | SALESFORCE.COM, INC. | 32 | -18% |
| 72 | WILLIAMS-SONOMA, INC. | 32 | 191% |
| 72 | CALLAWAY GOLF COMPANY | 32 | 7% |
| 72 | 3M COMPANY | 32 | -30% |
| 72 | NICOVENTURES HOLDINGS LIMITED | 32 | 68% |
| 78 | FISHER & PAYKEL HEALTHCARE CORPORATION LIMITED | 31 | 24% |
| 78 | NISSAN MOTOR CO., LTD. | 31 | -44% |
| 78 | ROCHE HOLDING AG | 31 | -3% |
| 78 | CATERPILLAR INC. | 31 | -24% |
| 78 | RIVIAN IP HOLDINGS, LLC | 31 | 11% |
| 78 | ALTRIA GROUP, INC. | 31 | -14% |
| 78 | THE NOCO COMPANY | 31 | 138% |
| 85 | SICHUAN QIANLI-BEOKA MEDICAL TECHNOLOGY INC. | 30 | 900% |
| 85 | BEIJING ROBOROCK TECHNOLOGY CO., LTD. | 30 | 1400% |
| 85 | BEIJING ZITIAO NETWORK TECHNOLOGY CO., LTD. | 30 | 400% |
| 85 | HITACHI, LTD. | 30 | -29% |
| 89 | STEELCASE INC. | 29 | 16% |
| 89 | META PLATFORMS, INC. | 29 | -60% |
| 89 | KADTC PET SUPPLIES INC | 29 | n/a |
| 89 | P&P IMPORTS LLC | 29 | 12% |
| 89 | LOUIS VUITTON MALLETIER | 29 | 107% |
| 94 | GOPRO, INC. | 28 | -10% |
| 94 | INTERDESIGN, INC. | 28 | 8% |
| 94 | MR. BAR-B-Q PRODUCTS LLC | 28 | 133% |
| 97 | OMRON CORPORATION | 27 | 42% |
| 97 | MERCHSOURCE, LLC | 27 | 125% |
| 99 | BRUNSWICK CORPORATION | 26 | 53% |
| 99 | WANGS ALLIANCE CORPORATION | 26 | n/a |
| 99 | SPECTRUM BRANDS HOLDINGS, INC. | 26 | -49% |
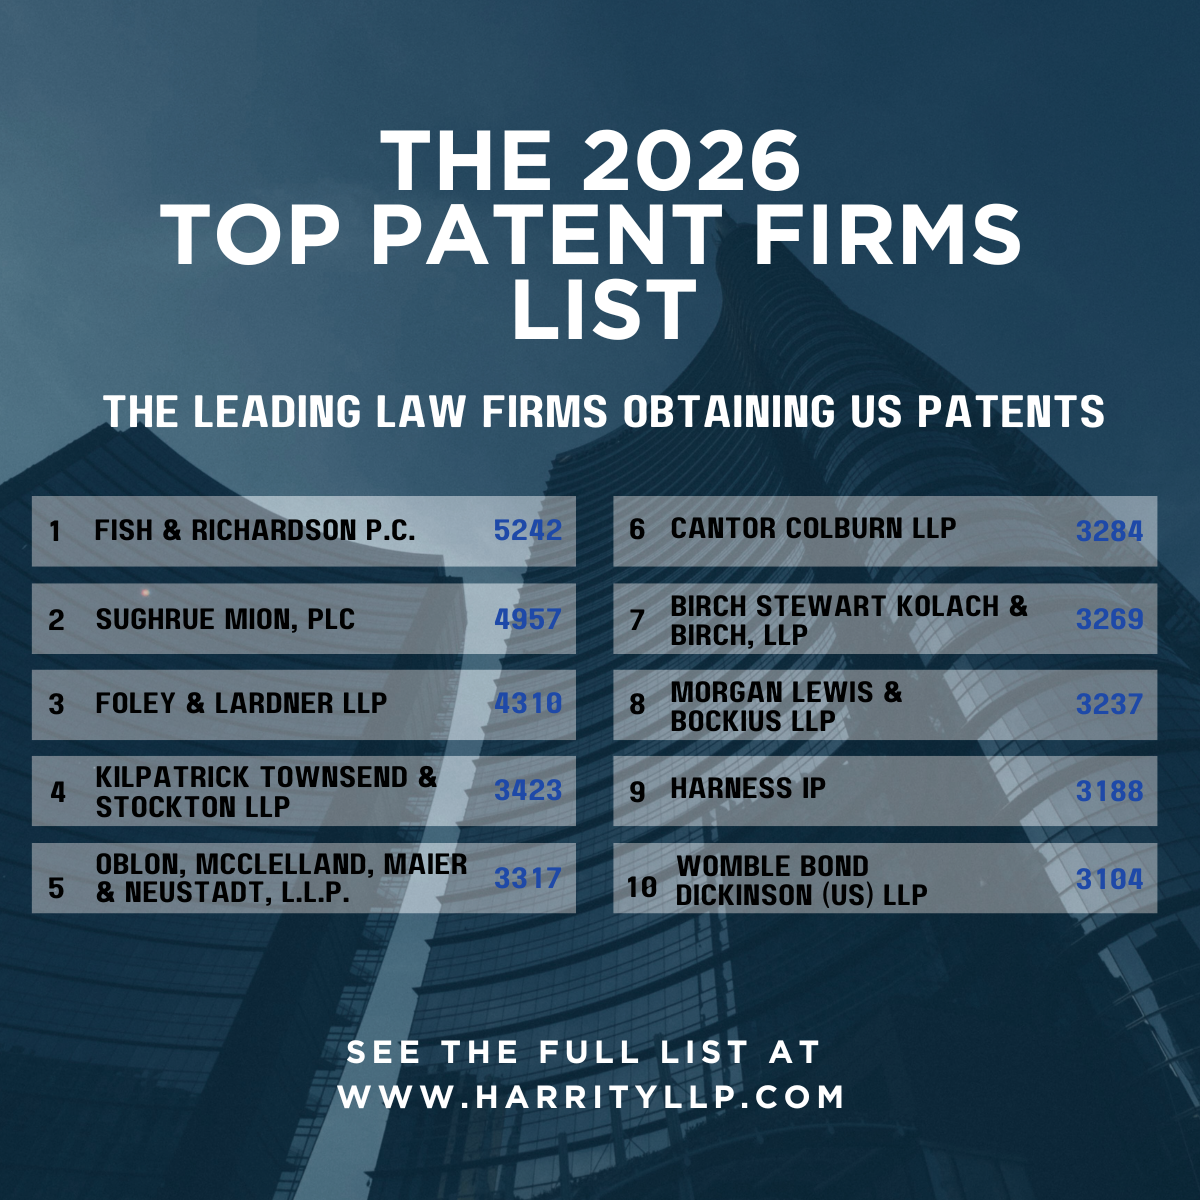
Harrity Patent Analytics Unveils 2026 Top Patent Firms Ranking
Harrity Patent Analytics Unveils 2026 Top Patent Firms Ranking Discover the Leading Law Firms by Rank of Patents Obtained in 2025 WASHIN...
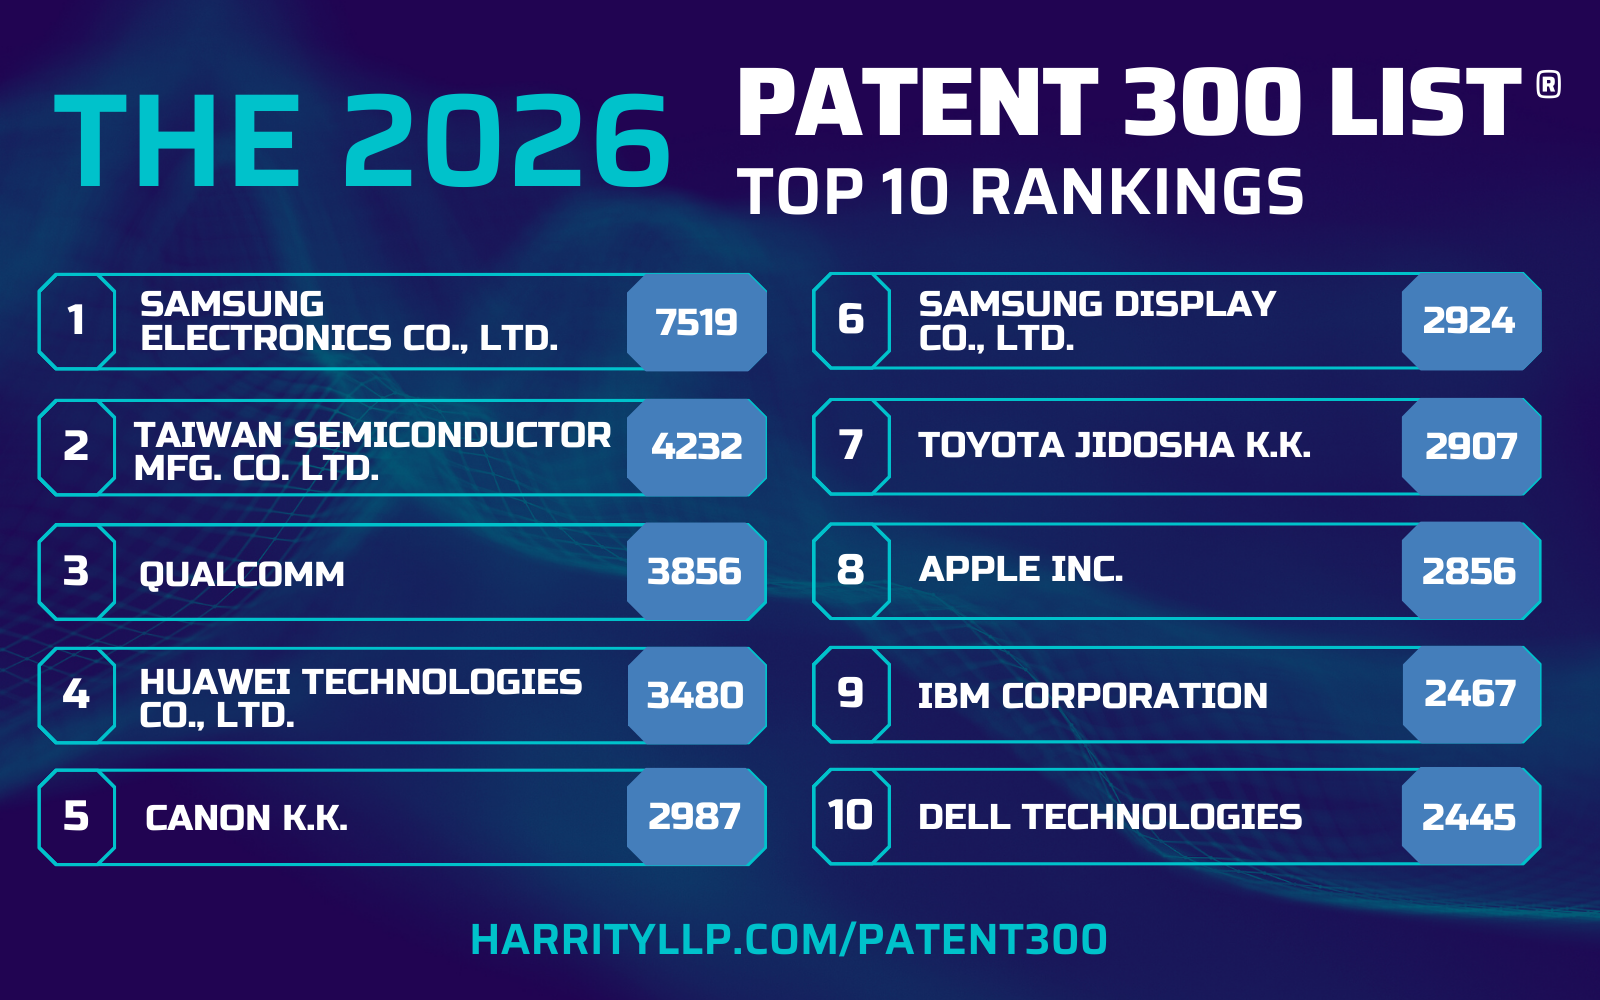
Harrity Patent Analytics Releases the 2026 Patent 300® Report
Harrity Patent Analytics Releases the 2026 Patent 300® Report Top 300 Patent Innovators Ranked by U.S. Utility Patents Granted in 2025 W...
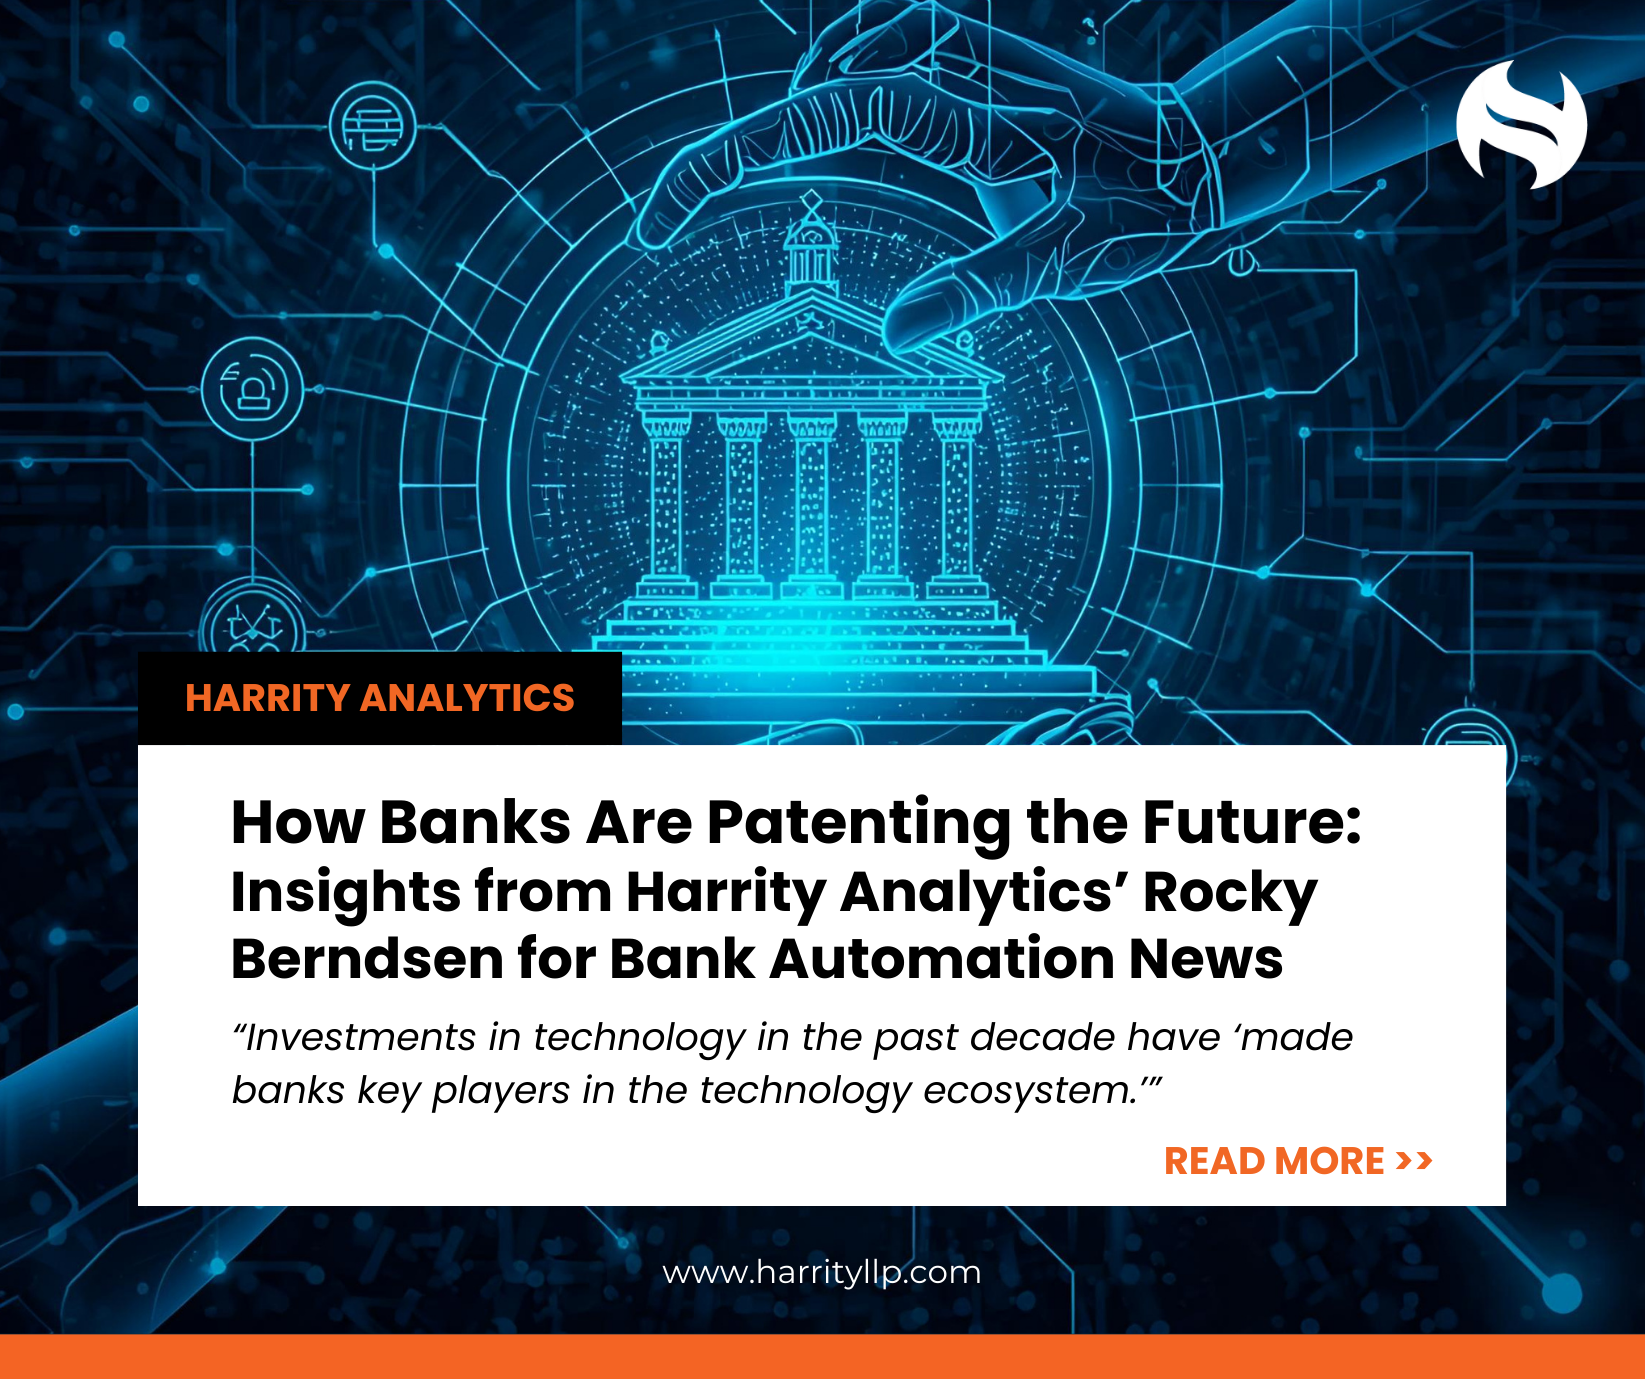
How Banks Are Patenting the Future: Insights from Harrity Analytics’ Rocky Berndsen
How Capital One and Other Banks Are Patenting the Future — Insights from Harrity Analytics’ Rocky Berndsen Banks are no longer just financi...
Autonomous Vehicles: Driving Innovation
By Ayana Marshall, PhD Autonomous Vehicles: Driving Innovation Autonomous vehicles (AVs), commonly referred to as self-driving cars,...

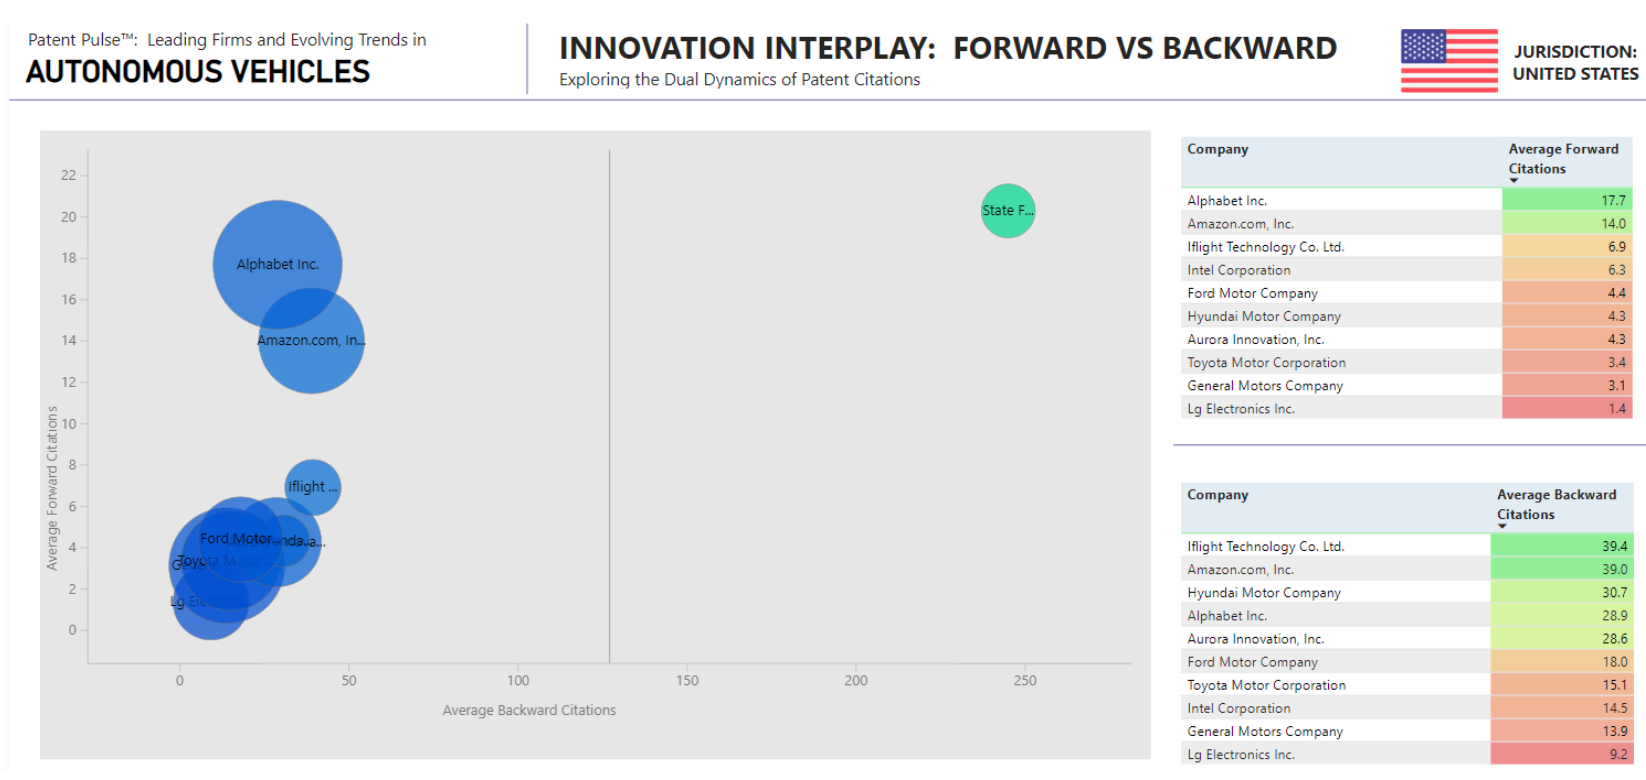
Driving the Future: Exploring Patenting in Autonomous Vehicle Technology
By Ayana Marshall, PhD Autonomous vehicles (AVs), or self-driving cars, rely on sensors, cameras, radar, and artificial intelligence (AI)...

Navigating the Future of Sustainable Transport: Patent Trends in Electric Vehicles and Electrified Roadways
By Ayana Marshall, PhD Electric vehicles (EVs) and electrified roadways represent two major technological advances in sustainable t...

Gate Keepers vs. the Hindered: 102 Blocking in Artificial Intelligence for Wireless Telecommunications
By Ayana Marshall, PhD In the rapidly evolving sector of wireless telecommunications, Artificial Intelligence (AI) is driving major...

Tech Titans 2024: Top 25 Innovators in 3D Printing
Introduction The field of 3D printing continues to revolutionize industries across the globe, from aerospace to healthcare, enabling the...

Neuromorphic Revolution: Patents Fueling the Future of Brain-Inspired Computing
Neuromorphic Revolution: Patents Fueling the Future of Brain-Inspired Computing By Ayana Marshall, PhD Neuromorphic chips and neuromorp...
Tech Titans 2024: Top 25 Advanced Robotics Innovators
Introduction In the ever-evolving world of advanced robotics, innovation drives the industry forward, shaping the future of automation, a...

Seeing Double: How Digital Twins Are Driving a New Era of Innovation
Seeing Double: How Digital Twins Are Driving a New Era of Innovation By Ayana Marshall, PhD As technology continues to advance, digital...

Quantum Leap: Quantum Cryptography Patent & Pending Application Holders
By Ayana Marshall, Ph.D, Patent Data Analyst Quantum cryptography is advancing rapidly due to the imminent threat posed by quantum comput...

Unveiling the Brains Behind AI Patenting: Leading Inventors Transforming Technology
By Ayana Marshall, Patent Data Analyst Artificial intelligence (AI) has come a long way thanks to its top inventors. Their groundbreakin...
Who’s Conquering the AI Globe? The Patent Showdown Between Reach & Influence
By Ayana Marshall, Patent Data Analyst The scope of Artificial Intelligence (AI) patents is a key indicator of innovation and global reac...

AI Titans: Who’s Dominating the Patent Universe
By Ayana Marshall, Patent Data Analyst In the rapidly advancing field of technology, Artificial Intelligence (AI) is a notable area of fo...

102 Blocking Patents as an Indication of High-Quality AI Patent Portfolios
By Ayana Marshall, Patent Data Analyst The hottest area for patenting globally is in Artificial Intelligence (AI) innovation, and one ind...
Apple Vision Pro: A Patent Look at the New Entrant in Virtual Reality
By Ayana Marshall, Patent Data Analyst Introduction Virtual Reality (VR) has evolved from a futuristic concept to an everyday reality...
Trends and Implications of Decreasing Average Office Actions Per Patent at the USPTO
By Rocky Berndsen, Head of Analytics The United States Patent and Trademark Office (USPTO) has been observing a notable trend over the pa...
Unveiling the Power of Bubble Charts in Competitive Intelligence: A Quantum Computing Perspective
By Rocky Berndsen, Head of Analytics In the realm of competitive intelligence, especially within the patent field, traditional metrics su...
Maximizing Efficiency: A Case Study on Using the Patent 300® Report for Assessing Law Firm Performance
By Rocky Berndsen, Head of Analytics In the ever-evolving realm of patent law, in-house attorneys face the critical task of assessing and...