Harrity Patent Analytics Releases the 2026 Patent 300® Report
Harrity Patent Analytics Releases the 2026 Patent 300® Report
Top 300 Patent Innovators Ranked by U.S. Utility Patents Granted in 2025
WASHINGTON (January 26, 2026) – Harrity Patent Analytics is proud to announce the release of the 2026 Patent 300® Report. This annual report ranks the top 300 companies, organizations, and universities based on the total number of U.S. utility patents issued in the previous year.
The 2026 Patent 300® reveals notable shifts in innovation leadership across industries, with significant gains in patent filings by major players in the semiconductor, electronics, and automotive sectors. The list represents over 54% of the more than 330,000 patents issued in 2025.
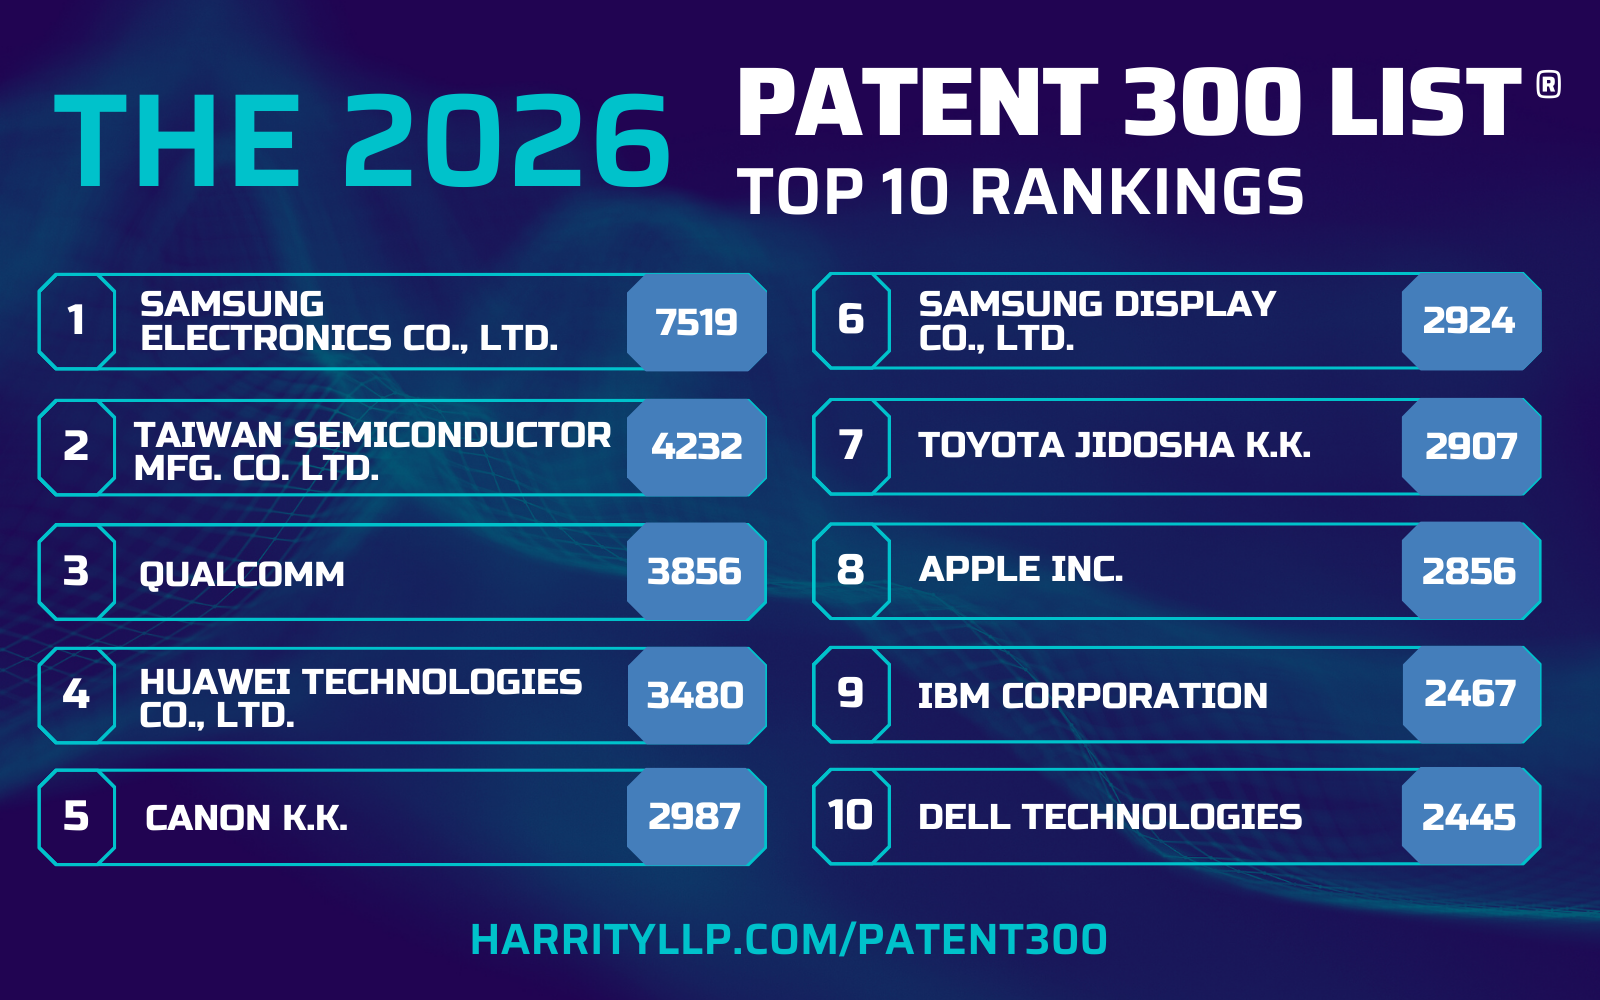
Top 10 Organizations from the 2026 Patent 300® Report:
- Samsung Electronics Co., Ltd. – 7,519 patents (+12% YoY)
- Taiwan Semiconductor Mfg. Co. Ltd. – 4,232 patents (+6% YoY)
- Qualcomm – 3,856 patents (+10% YoY)
- Huawei Technologies Co., Ltd. – 3,480 patents (+6% YoY)
- Canon K.K. – 2,987 patents (+13% YoY)
- Samsung Display Co., Ltd. – 2,924 patents (+11% YoY)
- Toyota Jidosha K.K. – 2,907 patents (+19% YoY)
- Apple Inc. – 2,856 patents (-8% YoY)
- IBM – 2,467 patents (-11% YoY)
- Dell Technologies – 2,445 patents (+38% YoY)
“The Patent 300® continues to provide a clear window into the world’s innovation leaders,” said Rocky Berndsen, Head of Patent Analytics at Harrity & Harrity. “This year’s data shows impressive growth in semiconductor and display technologies, alongside a strong resurgence in patenting activity at companies like Dell and Toyota.”
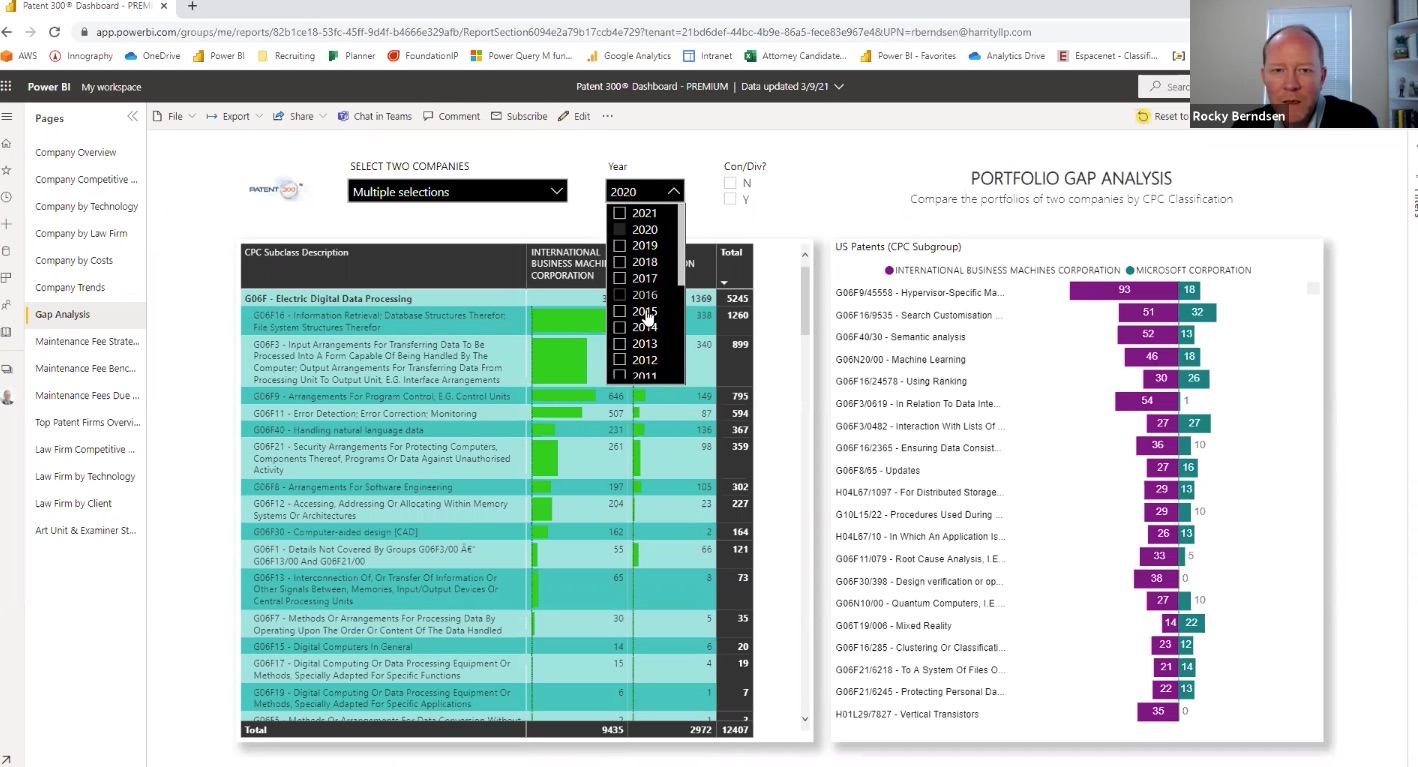
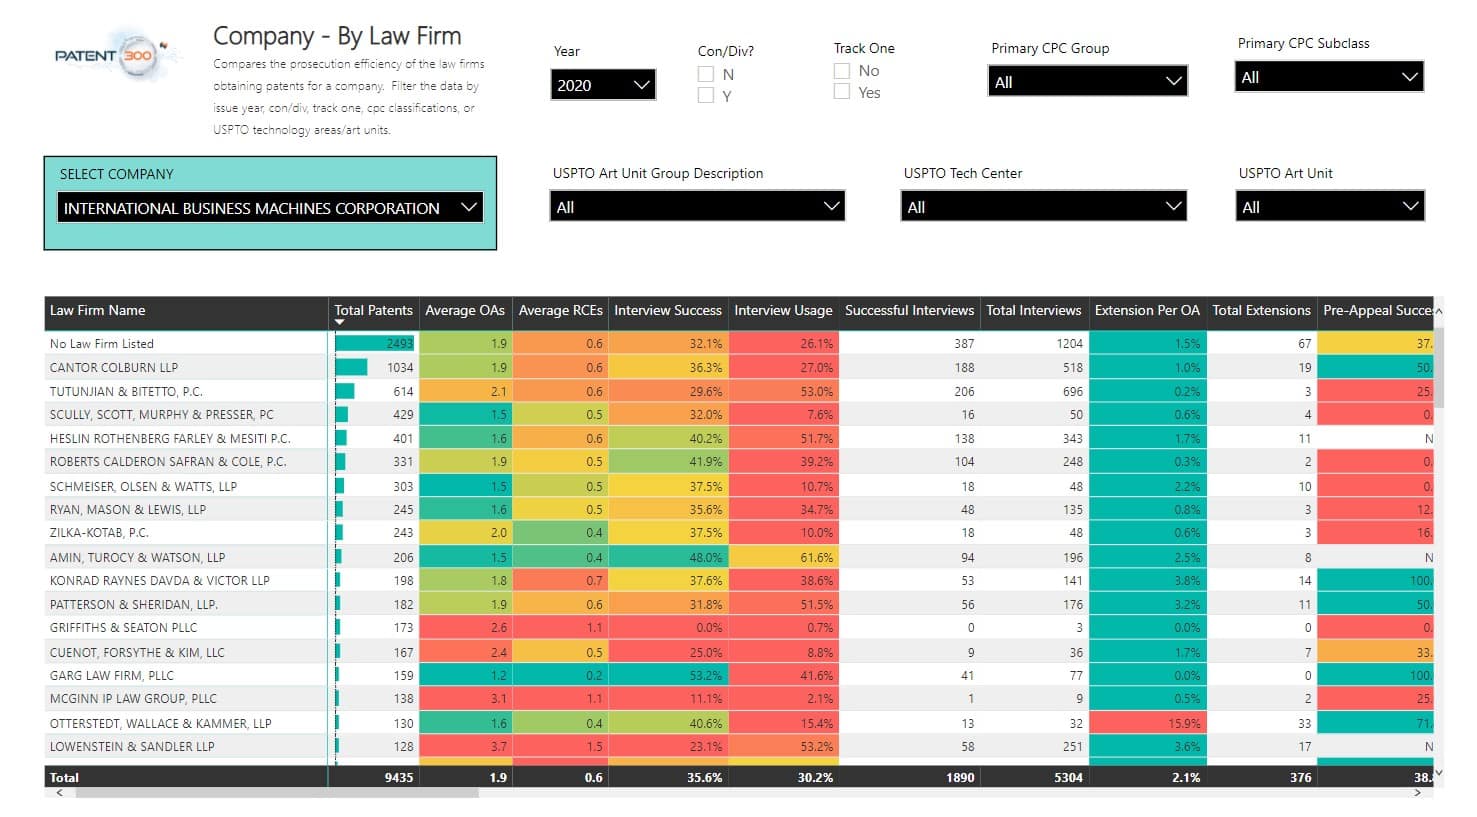
In addition to the full report, Harrity offers access to the Patent 300® Dashboard, the IP industry’s leading analytics platform for patent insights and competitive intelligence. The dashboard includes hundreds of companies and delivers detailed prosecution metrics, portfolio analytics, technology area segmentation, and budget modeling.
From technology giants to pioneering startups and leading research institutions, the 2026 Patent 300® Report is the industry benchmark for assessing innovation through patent activity.
To explore the full rankings and access the Patent 300® Dashboard, visit: www.harrityllp.com/patent300
About Harrity Patent Analytics
Harrity Patent Analytics, a division of Harrity & Harrity, LLP, specializes in advanced patent data analysis to help clients make informed strategic decisions. Our tools are built to support the IP strategies of Fortune 500 companies, law firms, and universities with actionable insights into patent portfolios and filing trends. Learn more at harrityllp.com/services/patent-analytics.