Unveiling the Power of Bubble Charts in Competitive Intelligence: A Quantum Computing Perspective
By Rocky Berndsen, Head of Analytics
In the realm of competitive intelligence, especially within the patent field, traditional metrics such as patent counts have long been the standard for assessing a company’s patent portfolio strength. However, this quantitative approach often overlooks the qualitative aspects of patents, which can provide deeper insights into a company’s technological prowess and strategic positioning. Our recent Quantum Computing – Patent Pulse Report introduces an innovative approach to competitive benchmarking that utilizes bubble charts, offering a more nuanced view of the landscape. To download the complimentary Quantum Computing Patent Pulse Report, CLICK HERE.
Beyond Counting Patents: The Need for Deeper Insights
While the number of patents a company holds is an important indicator of its activity in a particular technology area, it doesn’t tell the whole story. Two crucial qualitative metrics often overlooked are the influence of a patent, measured by the number of forward citations it receives, and the scope of its claims, typically gauged by the word count of the first claim. These metrics provide insights into the patent’s potential impact on future technologies and its breadth of coverage, respectively.
The Bubble Chart: A Visual Representation of Patent Quality and Quantity
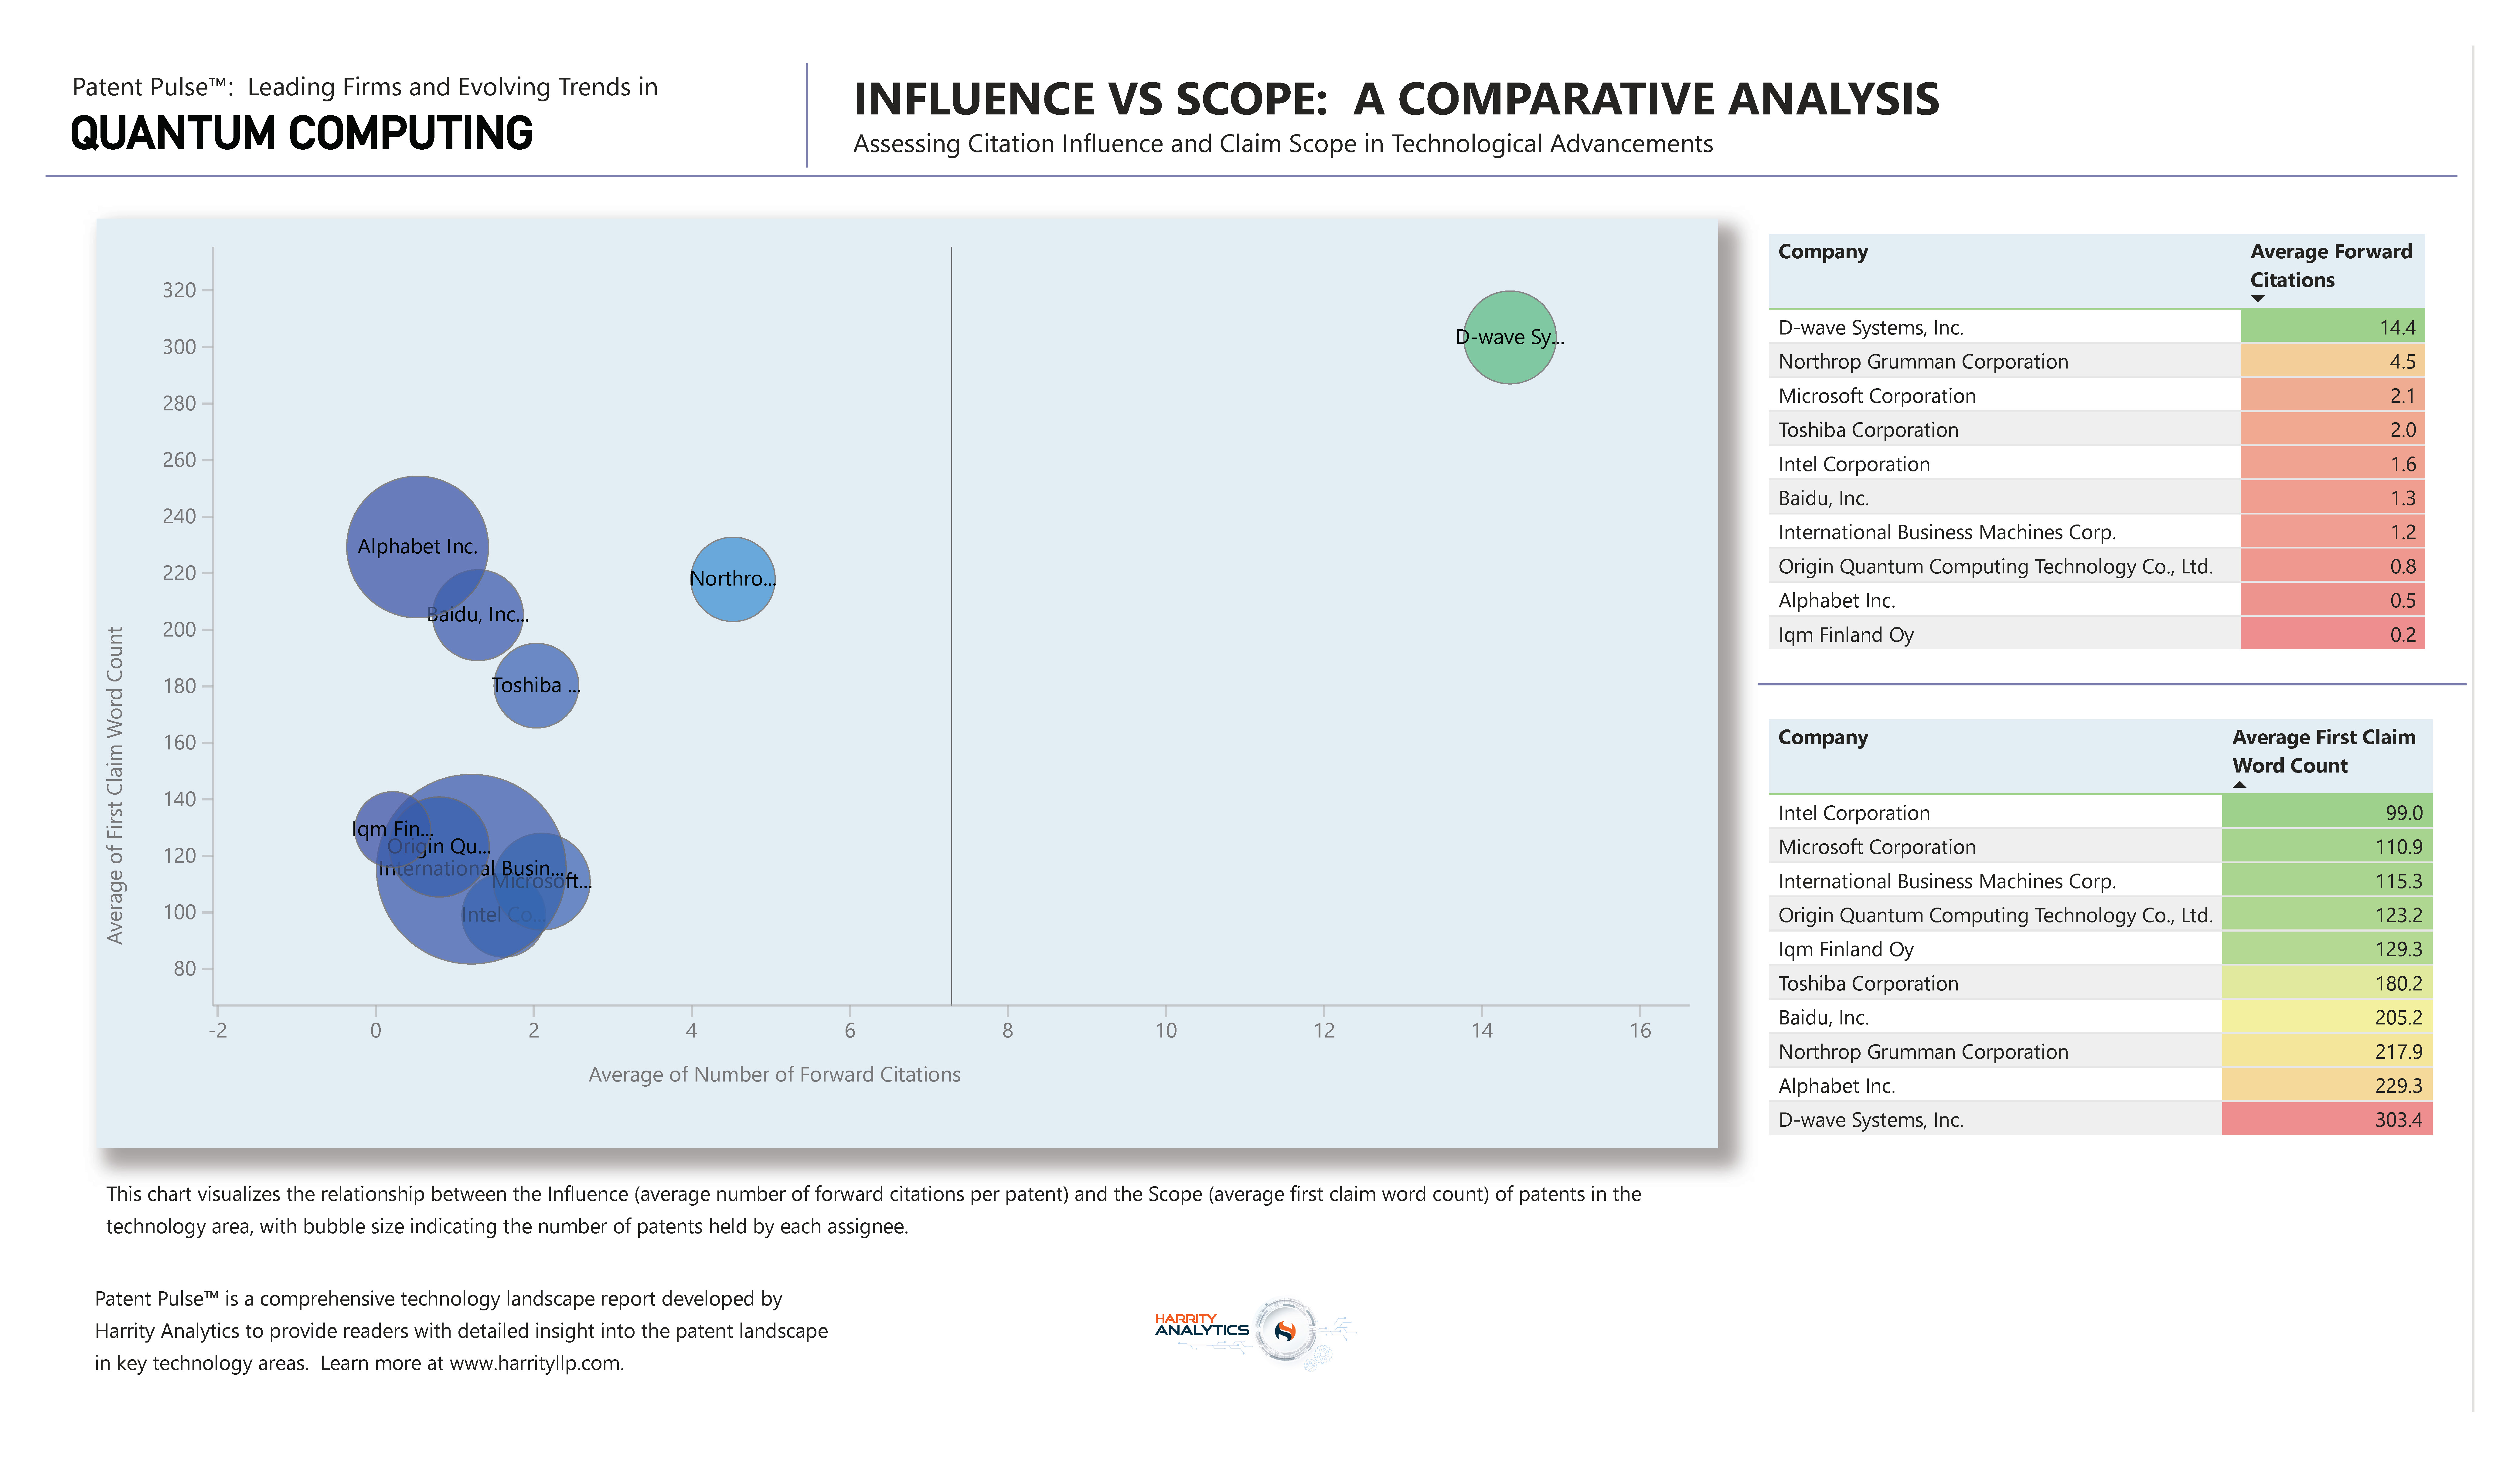
The bubble chart featured in our Quantum Computing report illustrates how these qualitative metrics can be visualized alongside quantitative ones. By plotting companies across two axes—average number of forward citations (influence) and average first claim word count (scope)—and using the bubble size to indicate the number of patents held, the chart provides a comprehensive view of each company’s patent portfolio in terms of both quality and quantity.
This visualization technique allows stakeholders to quickly identify leaders in the technology area, not just by the volume of their patents but by their potential impact and breadth.
Insights from the Quantum Computing Patent Landscape
The Quantum Computing – Patent Pulse Report reveals intriguing trends and strategic positions among key players in the quantum computing field. For example, D-wave Systems Inc. stands out with patents that have the highest average first claim word count and the highest average forward citations. To download the complimentary Quantum Computing Patent Pulse Report, CLICK HERE.
The Strategic Value of Bubble Charts in Competitive Benchmarking
The use of bubble charts for competitive benchmarking analyses offers several advantages:
- Comprehensive Insights: It provides a holistic view of a company’s patent portfolio, combining quantity with qualitative metrics.
- Strategic Decision-Making: Companies can identify not only their position but also their competitors’ strategic focuses, guiding R&D investments and patenting strategies.
- Identifying Innovation Leaders: Stakeholders can pinpoint which companies are setting the pace in technological advancements, potentially guiding partnership or acquisition decisions.
Conclusion
As the patent landscape becomes increasingly complex, tools like bubble charts that offer multi-dimensional analyses become invaluable. Our Quantum Computing – Patent Pulse Report is a testament to the power of such analytical tools in revealing the nuances of competitive positioning and technological leadership. By moving beyond simple patent counts to a richer, more informative analysis, we can gain true insights into the dynamics of innovation across industries.

