By Ayana Marshall, Patent Data Analyst
Introduction
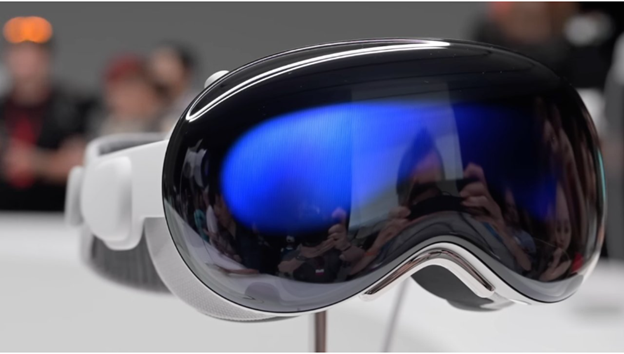
Virtual Reality (VR) has evolved from a futuristic concept to an everyday reality, and with Apple’s launch of the Vision Pro headset, the technology giant is now staking its claim in this innovative field. This article takes a closer look at the Vision Pro, examining how it fits into an already dynamic market and patenting landscape, and what its arrival signifies for the future of VR.
Overview of Apple’s Vision Pro
The Apple Vision Pro is designed for seamless integration across the Apple ecosystem, enhancing the user experience on all Apple devices.
Computational Power, Latency, and Memory Bandwidth
Powered by the M2 chip, the Vision Pro balances high-speed processing with energy efficiency, further enhanced by a 10-core GPU and a 16-core Neural Engine. With 16GB of unified memory, it supports efficient data processing and multitasking. The introduction of the R1 chip reduces photon-to-photon latency to 12 milliseconds, enhancing immersion and minimizing motion sickness, while a 256GB/s memory bandwidth ensures responsive VR interactions.
Display Technology, Audio Technology, and Media Playback
Its display employs micro-OLED technology with 23 million pixels, delivering visuals supported by a wide color spectrum and variable refresh rates for smooth motion. An array of advanced sensors and cameras enables environmental mapping and motion tracking, complemented by passthrough technology that blends virtual and physical spaces for enhanced user awareness. The Vision Pro’s immersive audio experience, enriched by Spatial Audio with dynamic head tracking, personalized audio ray tracing, a six-mic array with directional beamforming, and ultra-low-latency connections with AirPods Pro (2nd generation). Additionally, extensive support for audio and video formats ensures high-fidelity content consumption.
Operating System, Battery Life and Charging
visionOS, Apple’s platform for spatial computing, is the operating system for the Vision Pro. This operating system enhances the VR experience by leveraging the device’s advanced hardware for seamless navigation and immersive applications, integrating tightly with the Apple ecosystem. It supports eye and hand controls and is compatible with physical keyboards, trackpads, and game controllers. The Vision Pro’s optimized battery life supports extended use, and advanced connectivity options with Wi-Fi 6 (802.11ax) and Bluetooth 5.3 provide reliable streaming and device pairing.
Input Methods, Ergonomics and Physical Design
Input versatility includes interactions through hands, eyes, voice, and supported accessories like keyboards, trackpads, and game controllers, broadening usability. Items can be chosen simply by gazing at them and tapping fingers together, while pinching, dragging, zooming, and rotating objects can be accomplished using specific hand gestures. The adjustable Interpupillary Distance (IPD) and the device’s lightweight design provide visual comfort and ease of use.
Security and Accessibility Features
Security is a priority, with Optic ID offering iris-based biometric authentication, encrypting data securely to protect user privacy. A key aspect of the Vision Pro is its comprehensive accessibility features, designed to empower individuals with disabilities to fully engage with their device.
Exploring the VR Market Dynamics
The Vision Pro enters a market with well-known products like the Sony PlayStation VR, HTC Vive, and Meta’s Quest 3. These systems have already established their places in the VR market, creating a competitive environment for the introduction of the Apple Vision Pro.
Patents as Innovation Indicators
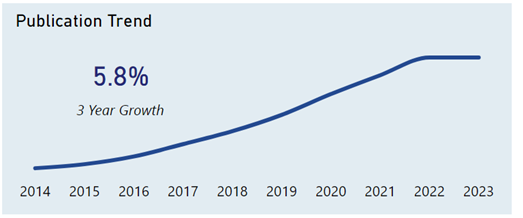
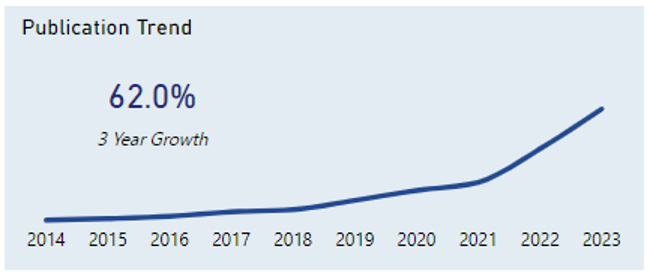
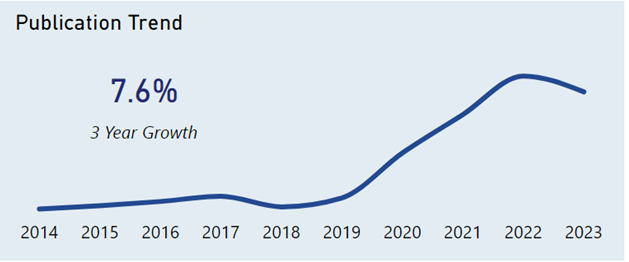
Based on data provided by the Harrity Analytics Patent Pulse™ Report on VR Hardware, the trend in VR hardware patent publications has experienced a consistent increase up to 2022, after which it levels off. Over the past three years, there has been an annual growth of 5.8% in patent publications. An increase in patent filings typically reflects a period of innovation, as companies seek to secure legal protection for their new inventions. The data suggests progress in VR hardware development, pointing to the technology’s ongoing expansion and adoption.
Analyzing the Growth of VR Hardware Patents: A Snapshot of Industry Leaders and Apple’s Position
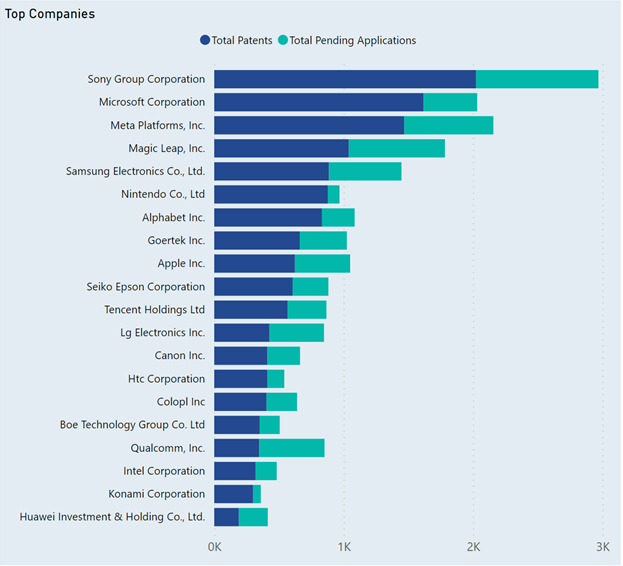
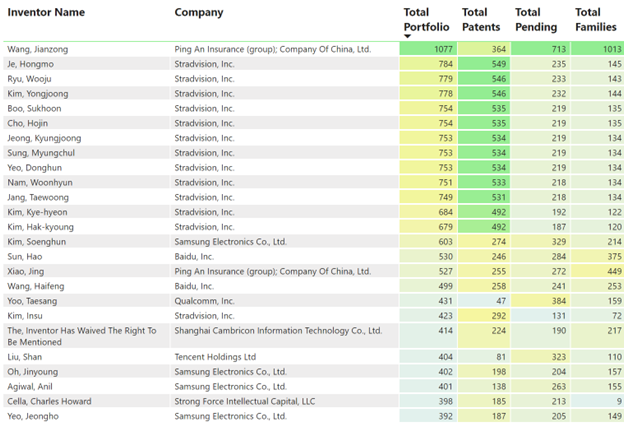
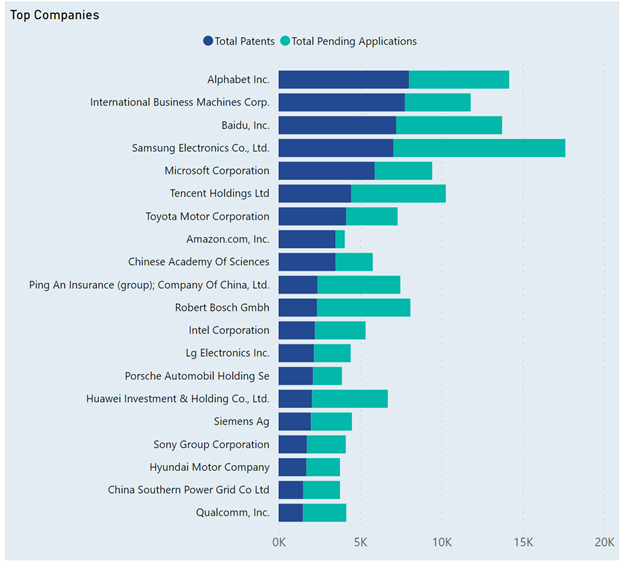
The chart presents data on the patent activities of leading corporations in the VR domain, specifically comparing the number of patents to the number pending applications. This data provides a snapshot of VR technology patenting from technology giants. The following are highlights from this chart:
- Sony Group Corporation leads with the highest patent count.
- Microsoft, Meta Platforms, Magic Leap, Samsung, and Nintendo follow as top patent holders.
- These companies have many pending applications, showing active VR development.
- Apple Inc. ranks in the top 15, with fewer patents than the leaders.
How Does Apple’s Growth in VR Patent Publications Compare to Industry Leaders?
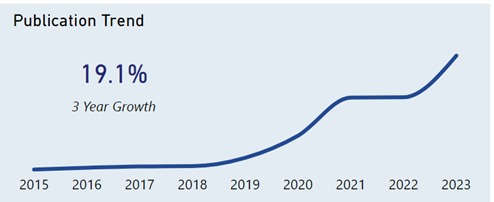
The following are the highlights from this chart about Apple’s publication trends:
- Apple’s publication growth in 3 years: 19.1%, more than triple the entire VR sector’s growth.
- Significant growth observed from 2019 to 2021, followed by a stable period.
- Growth resumed in the years 2022 to 2023.
The Competitive Ecosystem
As Apple’s Vision Pro joins the competitive landscape of virtual reality headsets, it stands amidst established players like Meta’s Quest series and Sony’s PlayStation VR. Apple’s entry introduces its distinct blend of technologies and design philosophies, aiming to carve out its niche in a market that values innovation and user-centric experiences. This environment, where companies not only compete on product capabilities but also on the intellectual property front, highlights a dynamic interplay of market strategies and technological advancements.
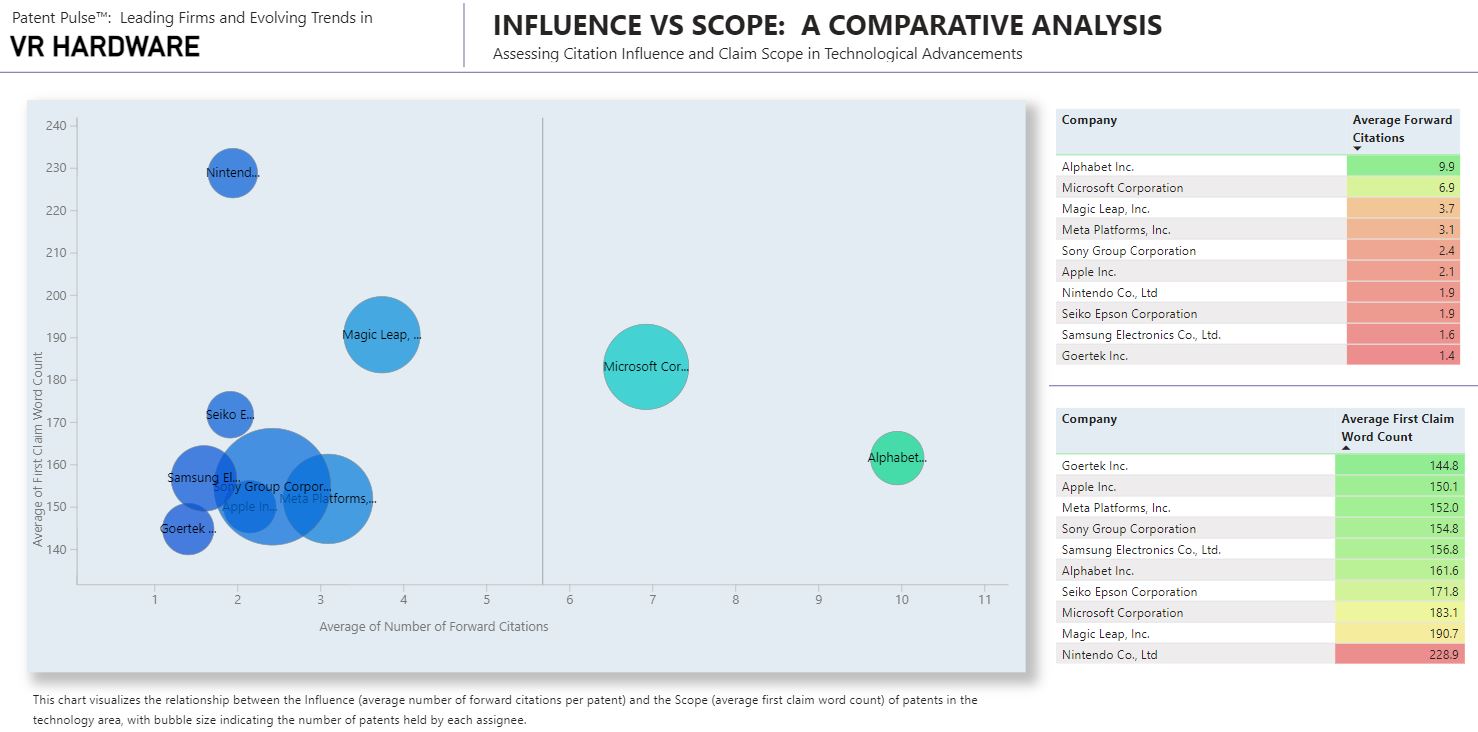
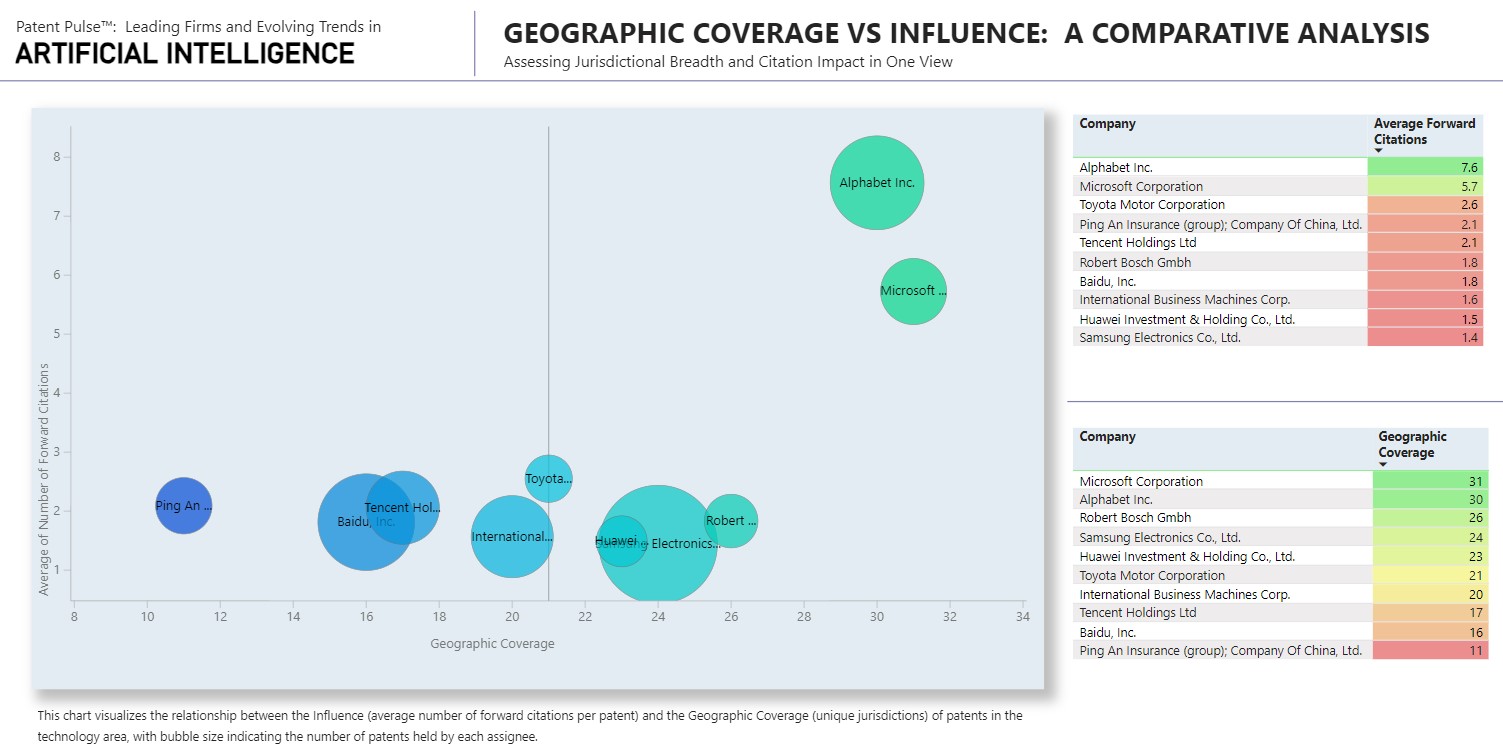
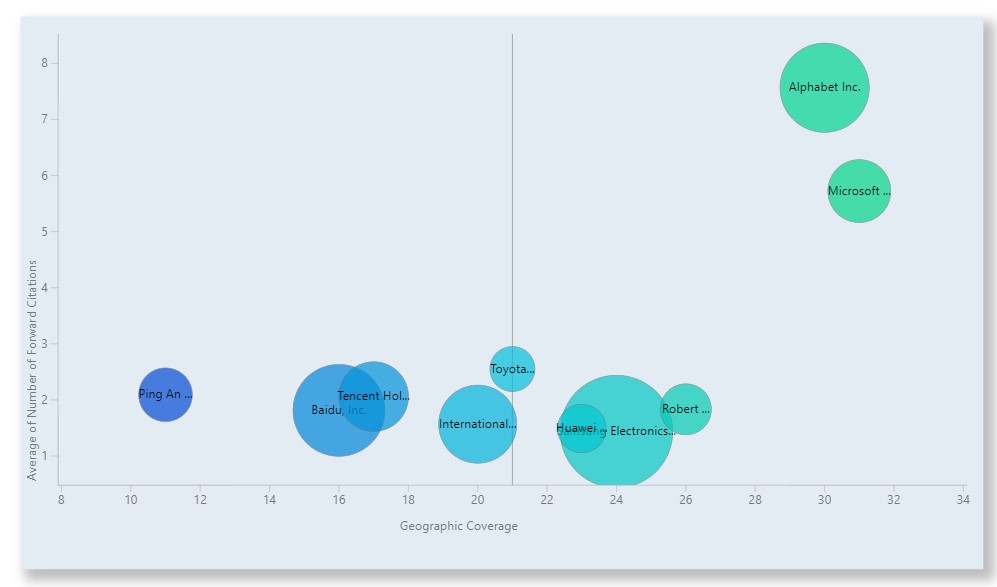
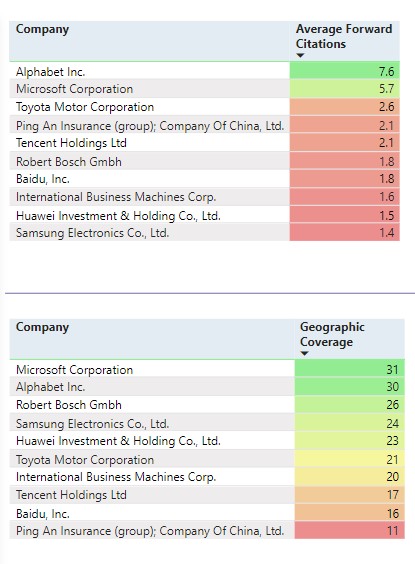
The chart provides a visual comparison of the influence and scope within the VR hardware patent landscape. Influence is gauged by the average number of citations a company’s patents receive, indicating their significance to subsequent technological developments. Scope is measured by the length of a patent’s first claim, which can reflect the breadth of the invention’s protection. Larger bubbles represent a higher quantity of patents held by each entity. The following are highlights from this chart:
- Microsoft and Alphabet have influential patents with shorter claim lengths.
- Goertek and Nintendo’s patents feature longer first claims.
- Apple’s patents have lower influence based on forward citations and have fewer words in the first claim.
Analyzing the Impact and Breadth of VR Patent Portfolios
Building on the understanding of patent activity as an indicator of technological development, further analysis can be conducted by examining the nuances of patent influence against the diversity of technology within the VR sector. Review of such metrics provides insight into how companies balance the breadth of their technological advancements with the impact of their intellectual contributions. This approach to patent analysis offers a unique perspective on how a company like Apple, with its moderate citation influence and longer first claims, positions itself among peers in terms of technological diversity and patent influence.
This chart offers a visual representation of the interplay between the number of forward citations—a marker of influence—and the technological diversity, as indicated by unique Cooperative Patent Classification (CPC) codes, for patents in the VR hardware domain. The bubble sizes reflect the volume of patents each company holds. The following are highlights from this chart:
- Microsoft and Alphabet have a high average of forward citations and multiple unique CPC codes.
- Sony and Meta Platforms demonstrate significant technological diversity.
- Apple holds moderate influence and technological diversity in this context.
The Future is Now
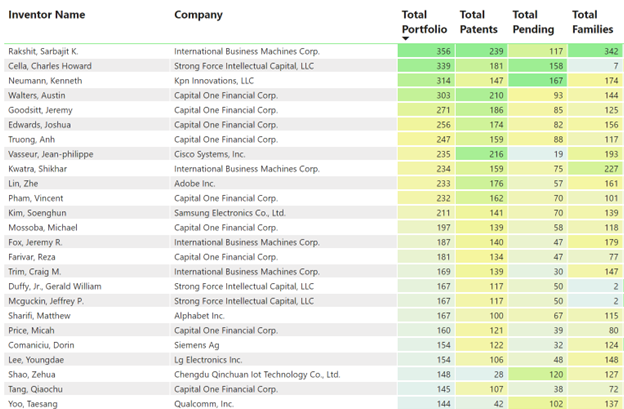
Apple’s Vision Pro is not the only VR headset to be introduced to the market in 2024. The VR hardware landscape is set for potential other new releases from companies that include Valve Corporation and ByteDance. Here is a summary of the most anticipated VR headsets:
- Project Moohan: Samsung and Google are partnering to develop an advanced XR headset that leverages Samsung’s hardware capabilities and Google’s Android XR software. This joint endeavor is positioned as a competitor to Apple’s Vision Pro, with an anticipated release in the summer of 2024.
- PICO 4: Parent company Bytedance has apparently not yet launched PICO 4 in the US.
- Valve VR Headset: Valve is currently working on the next iteration of its Valve Index VR headset, drawing upon its established VR expertise and extensive gaming catalogue.
- Valve “Deckard”: This appears to be a new venture by Valve, which may be the successor to the Index VR system.
While not dominating the VR landscape, the companies shown in the above image, including Valve Corporation and ByteDance Ltd., own multiple VR patents and have several applications pending. Their portfolios, though not as extensive as some competitors, reflect active participation in the VR sector.
Applications of VR Technology Beyond Entertainment
It should be noted that VR technology extends well beyond gaming into various sectors including the following:
- VR aids healthcare by enabling simulation of medical procedures and virtual patient rehabilitation.
- Education uses VR for immersive learning, allowing students to virtually visit historical locations or learn complex science.
- Real estate employs VR for remote property tours.
- Design and engineering benefit from VR’s ability to create 3D models, aiding visualization, and project iteration.
- The entertainment industry utilizes VR for immersive films and interactive storytelling experiences.
Conclusion
The launch of the Vision Pro signals Apple’s commitment to the VR segment. With Apple holding a growing position in terms of patent activity and having moderate influence and technological variety within the VR domain, Vision Pro’s future contributions to this sector are anticipated with interest.
This data is sourced from the Harrity Analytics Patent Pulse™ Report on VR Hardware. For more information about the Patent Pulse™ Report visit our website HERE, download a complimentary Patent Pulse Report HERE, or contact Harrity Analytics HERE.
Sources:
https://harrityllp.com/patent-pulse-report/
https://www.dexerto.com/tech/upcoming-vr-headsets-2156692/
https://deovr.com/blog/87-upcoming-vr-headsets
https://www.tomsguide.com/news/oculus-quest-3-release-date-rumors-specs-news#:~:text=The%20Meta%20Quest%203%20is,to%20say%20about%20that%20soon)
https://www.youtube.com/watch?v=dtp6b76pMak
https://www.apple.com/apple-vision-pro/
https://www.apple.com/apple-vision-pro/guided-tour/
https://www.apple.com/apple-vision-pro/specs/
https://www.apple.com/newsroom/2023/01/apple-unveils-m2-pro-and-m2-max-next-generation-chips-for-next-level-workflows/
https://forums.appleinsider.com/discussion/233273/hands-on-with-apple-vision-pro-in-the-wild
https://www.makeuseof.com/what-is-apples-r1-chip-how-does-it-compare-m1-and-m2/
https://www.hardwarezone.com.sg/tech-news-samsung-and-googles-xr-headset-expected-launch-2024
https://www.theverge.com/2023/12/13/23999883/the-pico-5-headset-might-be-canceled-but-bytedance-isnt-done-with-vr


.jpg)


