Harrity Patent Analytics Unveils 2026 Top Patent Firms Ranking
Harrity Patent Analytics Unveils 2026 Top Patent Firms Ranking
Discover the Leading Law Firms by Rank of Patents Obtained in 2025
WASHINGTON (February 3, 2026) Harrity Patent Analytics has published the 2026 Top Patent Firms list, recognizing the leading law firms securing U.S. utility patents in 2025. The annual ranking provides a transparent view of patent prosecution performance and underscores year-over-year growth trends that reflect broader shifts in the industry.
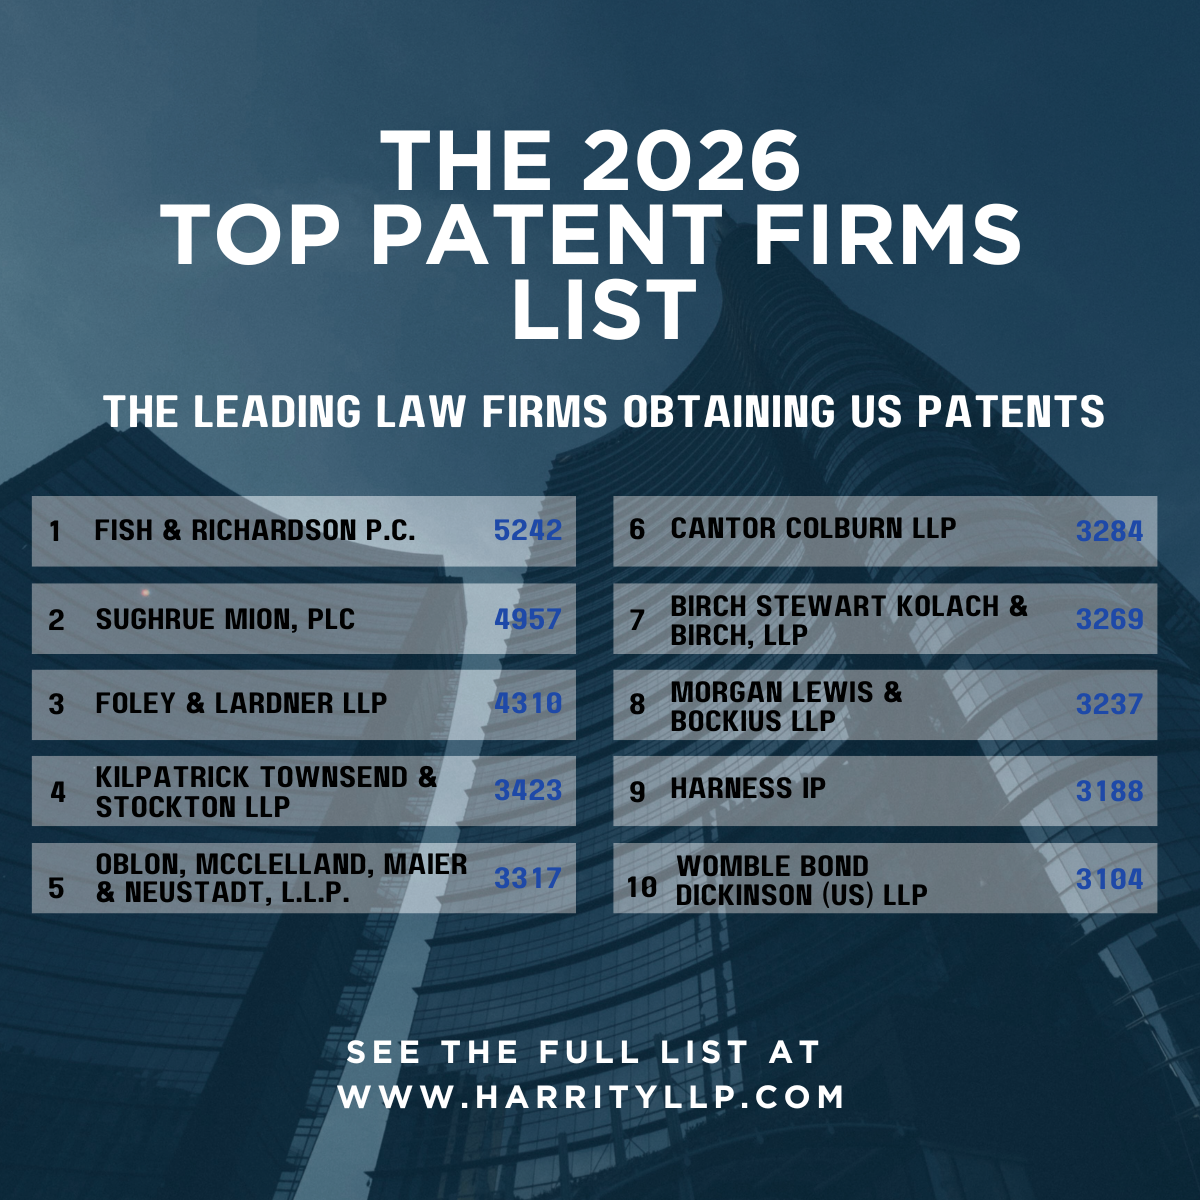
The top 10 firms on the 2026 list are:
- Fish & Richardson P.C. – 5,242 patents (‑3% YoY)
- Sughrue Mion, PLC – 4,957 patents (+11% YoY)
- Foley & Lardner LLP – 4,310 patents (+3% YoY)
- Kilpatrick Townsend & Stockton LLP – 3,423 patents (+2% YoY)
- Oblon, McClelland, Maier & Neustadt, L.L.P. – 3,317 patents (‑3% YoY)
- Cantor Colburn LLP – 3,284 patents (+8% YoY)
- Birch Stewart Kolasch & Birch, LLP – 3,269 patents (+6% YoY)
- Morgan Lewis & Bockius LLP – 3,237 patents (+17% YoY)
- Harness IP – 3,188 patents (‑7% YoY)
- Womble Bond Dickinson (US) LLP – 3,104 patents (+61% YoY)
These rankings reflect the firms that secured the highest numbers of U.S. utility patents in 2025, with several firms demonstrating robust growth compared to the prior year. Notably, Womble Bond Dickinson surged into the Top 10 with a 61% increase, marking the most significant year-over-year growth among the leading firms, followed by a 47% increase for Troutman Pepper (Ranked 51). While Fish & Richardson retained the #1 spot, its volume slightly declined by 3% compared to last year.
Rocky Berndsen, Head of Harrity Analytics, commented:
“The 2026 Top Patent Firms list offers a clear snapshot of who is driving patent prosecution volume in the United States. While total patent counts remain a core metric, the year‑over‑year trends also highlight firms that are rapidly expanding their patent practices. This benchmarking data empowers corporate IP leaders, law firms, and innovators to make informed strategic decisions in an increasingly competitive intellectual property landscape.”
The complete 2026 Top Patent Firms report is now available for download at https://harrityllp.com/services/patent-analytics/top-patent-firms/. The report includes detailed key statistics such as Office Actions and RCEs per patent, allowance rates, pendency, quality scores, and EOT percentages. It also offers robust benchmarking tools to help firms compare their performance against industry leaders, along with insights into year-over-year patent trends to identify which firms are growing or declining in volume.
About Harrity Patent Analytics
Harrity Patent Analytics, a division of Harrity & Harrity, LLP, specializes in advanced patent data analysis to help clients make informed strategic decisions. Our tools are built to support the IP strategies of Fortune 500 companies, law firms, and universities with actionable insights into patent portfolios and filing trends. Learn more at harrityllp.com/services/patent-analytics.