Inside the European Patent Revolution: An Analysis of Emerging Unitary Patent Data
Inside the European Patent Revolution: An Analysis of Emerging Unitary Patent Data
By Ayana Marshall, Patent Data Analyst
Brief Introduction to the Unitary Patent System
Launched on June 1, 2023, the Unitary Patent System, managed by the European Patent Office (EPO), simplifies patent protection across participating European Union (EU) member states. Replacing the need for separate validations in each state, it allows a single application and fee for protection in all participating countries. Based on the European Patent Convention (EPC), the system enables patent holders to seek uniform protection post-grant in 17 initial EU member states. The Unitary Patent is described as a “European patent with unitary effect”. The system includes the Unified Patent Court (UPC), comprising judges from participating states, adjudicating on Unitary and European patent infringements and validity. This system signifies a streamlined approach for patent protection in the EU.1-5
Trends in Unitary Patent Registrations
The European Patent Office (EPO) has compiled and shared data from the launch of the Unitary Patent System up to January 15, 2024. This includes various statistics and insights into how the system has been utilized. The following discussion will delve into the key elements and findings from this data set.
Requests for Unitary Effect
The data above reveals that the Unitary Patent System received 18,273 requests for unitary effect, with 17,733 successfully registered as patents. Additionally, the uptake rate for the system in 2024 stands at 17.3%. This statistic represents the proportion of total requests that resulted in registered patents within the specified timeframe.6
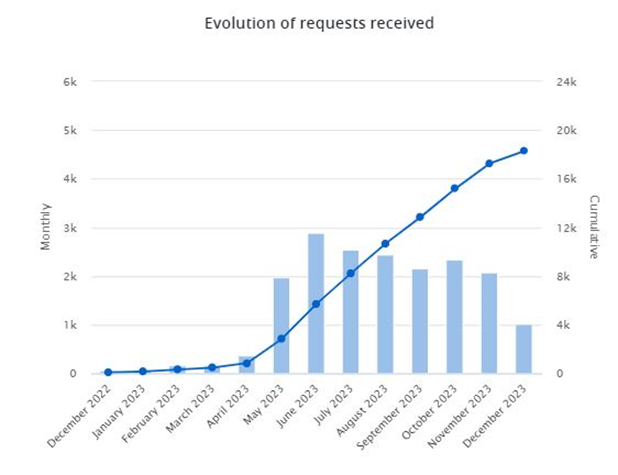
The chart above tracks unitary patent request trends from December 2022 to December 2023. Monthly request volumes, shown via bars, are aligned with the left vertical axis. The right axis and line graph represent the cumulative total of requests.
From December 2022 to June 2023, the chart shows a rise in monthly requests for unitary patents, starting below 1,000 and reaching around 2,000 by May with a peak of almost 3,000 in June 2023. July 2023 through September 2023 saw a decline in requests for unitary effect followed by a slight increase of just over 2,000 in October 2023. There was a subsequent decline to approximately 4,000 by December 2023. This illustrates the evolving interest and engagement with the Unitary Patent system over the year. The cumulative line shows a consistent and steady upward trajectory throughout the year, reflecting the addition of each month’s new requests to the total count. Starting at almost zero in December 2022, the cumulative count surpasses 20,000 by December 2023. This upward trend suggests growing interest in and engagement with the Unitary Patent system over the year.
Top 25 Companies (Proprietors)
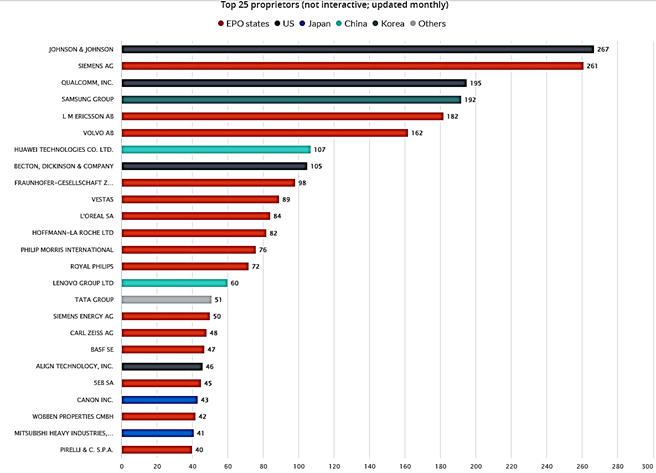
The chart above displays the number of unitary patent requests filed by the top 25 companies. The bars are color-coded to represent different regions: EPO states, the US, Japan, China, Korea, and Others. Johnson & Johnson holds the top position in terms of requests with the highest tally, followed by Siemens AG trailing by a narrow margin. Both corporations submitted requests in the mid-two-hundreds. Similarly, Qualcomm, Inc. and Samsung Group exhibit parallel levels of requests, showcasing comparable engagement in the unitary patent application process. The chart demonstrates a diversity of companies across different regions, with several companies from EPO states and the US occupying the top spots, while companies from Japan, China, and Korea also feature prominently, although with fewer requests.
Origin of Proprietors
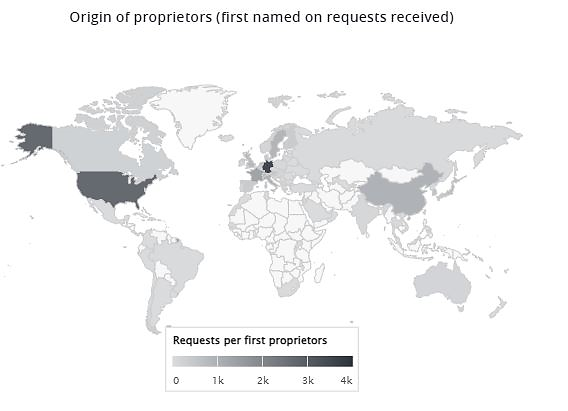
The map above illustrates the geographic distribution of patent proprietors, with Europe and North America exhibiting higher volumes of requests. Europe is particularly prominent, with requests ranging between 3,000 to 4,000, while the United States shows a lower range of approximately 2,000 to 3,000 requests.
WIPO’s Technology Fields (IPC)
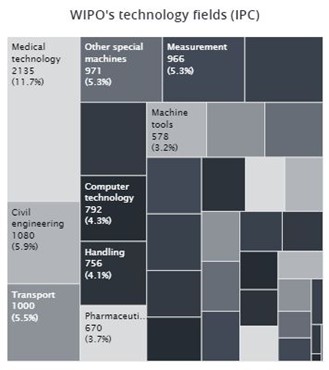
Medical technology and electrical machinery are the most represented technology fields, suggesting robust activity and interest in these areas. The technology fields are classified by the International Patent Classification (IPC) system, detailing the distribution of unitary patent requests across various sectors. The size of each block in the image corresponds to the number of requests in that technology field, with larger blocks indicating more requests. The technology fields include Medical technology, Computer technology, Pharmaceuticals, Civil engineering, Transport, Measurement, ‘Machine tools, Handling, and Other special machines.
Each technology field in the image above is quantified with a count and percentage, indicating its share of unitary patent requests. Medical technology leads with 2,135 requests, accounting for 11.7% of the total. Civil engineering, Transport, and Other special machines, also feature significantly with 1080 (5.9%), 1,000 (5.5%), and 971 (5.3%) requests respectively. Other fields like Computer Technology and Handling show smaller proportions, with 792 (4.3%) and 756 (4.1%) requests. The distribution of requests across these fields suggests a varied interest in unitary patent protection across different technology sectors.
Status of Registration
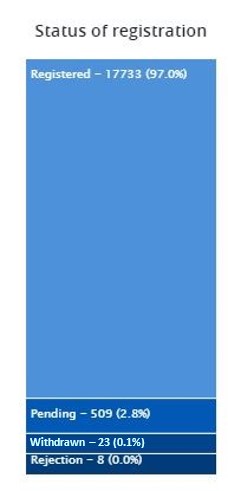
The status of registration represents the proportions of unitary patent applications in each stage of the registration process. The chart above quantifies and categorizes unitary patents according to their registration status of registered, pending, and rejection. Dominating the chart is the registered category with 17,733 cases, accounting for 97.0% of the total, while pending applications comprise 2.8% with 509 cases followed by the 23 (0.1%) cases that were withdrawn. The rejected category, representing the smallest segment, includes only 8 cases, making up a 0.04% of the total. This chart highlights the number of successful registrations in the unitary patent system.
Translation and Procedural Languages
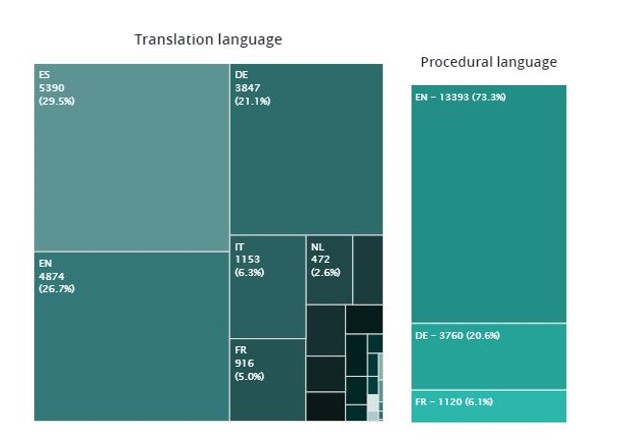
Data on translation and procedural languages used reveals that English is commonly used for both, with German and French also being used. English is used in 73.3% of procedural languages, a significant lead over German and French. Spanish is the mostly commonly used translation language outpacing English by a narrow margin.
In summary, the consolidated data provides insight into the unitary patent system as it currently stands. It appears to indicate active participation across various technological sectors, a high rate of patent registrations, and a wide geographic distribution of proprietors. The diverse origins of the applicants appear to highlight the system’s potential global appeal, and the significant majority of finalized registrations appear to suggest its efficiency. These details offer an understanding of how the system is being used, positioning it as a potentially key mechanism for safeguarding modern innovations. The detailed breakdown of request origins, technology fields, and registration statuses offers stakeholders an understanding of the system’s current scope and functionality.
For those interested in accessing customized analytics, contact Harrity Analytics today!
—
Stay tuned for more insights and analyses from Harrity Analytics, as we continue to explore the ever-evolving world of patents and innovation.
- https://www.epo.org/en/applying/european/unitary/unitary-patent
- https://www.epo.org/en/legal/guide-up/2022/uppg_a_v.html#:~:text=32The%20primary%20aim%20of,obtaining%2C%20maintaining%20and%20managing%20them.
- https://www.unified-patent-court.org/en
- https://www.epo.org/en/legal/guide-up/2022/uppg_a_iii_1.html
- https://www.epo.org/en/applying/european/unitary
- https://www.epo.org/en/about-us/statistics/statistics-centre#/unitary-patent
- All images were obtained from https://www.epo.org/en/about-us/statistics/statistics-centre#/unitary-patent
