Optics Ranks as the #5 Technology Area in the 2020 Patent 300®
The 2020 Patent 300® Report details the top 300 companies, organizations, and universities obtaining patents in the United States. Data from the report shows that nearly 56% of patents obtained in the U.S. in 2019 were by Patent 300® companies. The top 10 technology areas, which represent 47% of the 189,796 U.S. patents obtained by Patent 300® companies in 2019, are again dominated by electrical technologies.
Chart 1 shows the Optics technology area ranked the 5th largest in 2019. There were 9,830 patents issued for Patent 300® companies in the US. Optics covers the United States Patent & Trademark Office (USPTO) technology classifications for apparatus and corresponding processes used for storing and retrieving optical or magneto-optical information. The basis of the technology is relative movement between an optical storage carrier or medium and a transducer along a continuous path.
The class includes apparatus and corresponding processes for making copies or editing optical records, falling within the above definition. It includes the transfer medium having a specific information storage structure. The scope of the Optics technology class overlaps with other classes and subclasses. It is an integral part of the class of patents covering Dynamic Information Storage or Retrieval.
Chart 1 – Top 10 Technology Areas for Patent 300® (2019 U.S. Patents)
| Rank | Patent 300 Technology Area | 2019 U.S. Patents | Percentage of Total 2019 U.S. Patents |
|---|---|---|---|
| 1 | Semiconductors/Memory | 15841 | 8% |
| 2 | Electrical Circuits and Systems | 14269 | 8% |
| 3 | Multiplex and VoIP | 10824 | 6% |
| 4 | Printing/Measuring and Testing | 10383 | 6% |
| 5 | Optics | 9830 | 5% |
| 6 | Selective Visual Display Systems | 7338 | 4% |
| 7 | Thermal & Combustion Technology, Motive & Fluid Power Systems | 5951 | 3% |
| 8 | Computer Networks | 5753 | 3% |
| 9 | Cryptography and Security | 5016 | 3% |
| 10 | Telecommunications | 4714 | 2% |
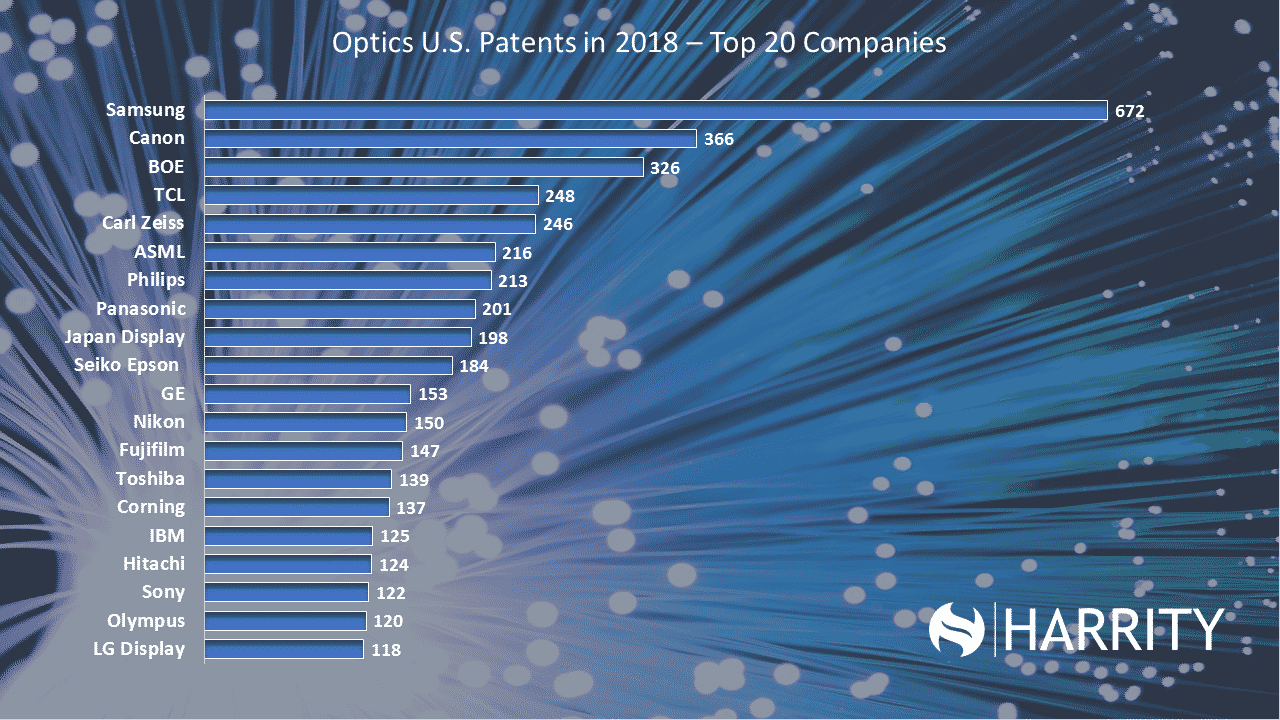
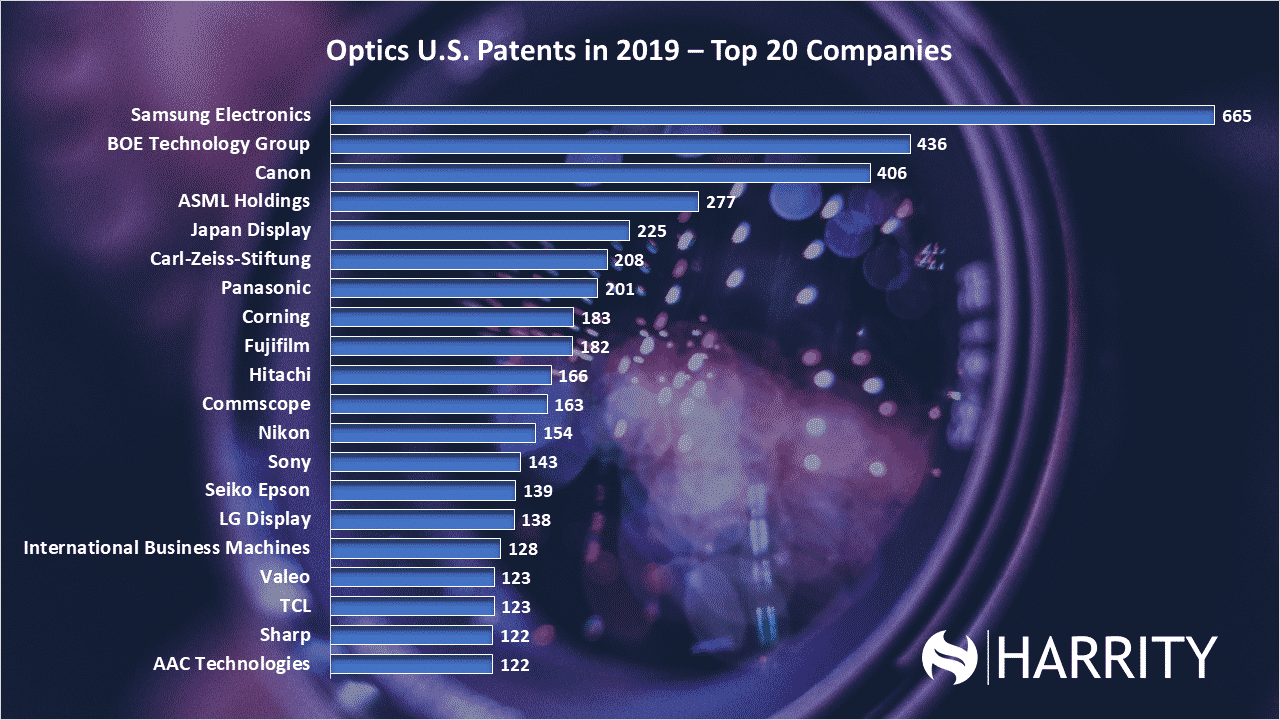
The top 20 companies in the Optics area, shown in Chart 2, are large global technology companies. They include Samsung Electronics (#1), BOE Technology (#2), Canon (#3), ASML Holdings (#4), and others. Samsung tops the list having obtained 665 US patents, a 1% decrease from 2018. BOE Technology had 436 US patents, a 34% increase from 2018. Canon, at 406, was up 11% from 2018. The top 20 companies represent a cross-section of the technology sector.
Chart 2 – Top 20 Companies by U.S. Patents in Optics
| Rank | Patent 300® | 2019 Optics Patents | % of Company's 2019 US Patents | 2018 Optics Patents | Change from 2018 Patents |
|---|---|---|---|---|---|
| 1 | Samsung Electronics | 665 | 8% | 672 | -1% |
| 2 | BOE Technology Group | 436 | 20% | 326 | 34% |
| 3 | Canon | 406 | 10% | 366 | 11% |
| 4 | ASML Holdings | 277 | 87% | 216 | 28% |
| 5 | Japan Display | 225 | 33% | 198 | 14% |
| 6 | Carl-Zeiss-Stiftung | 208 | 57% | 246 | -15% |
| 7 | Panasonic | 201 | 10% | 201 | 0% |
| 8 | Corning | 183 | 33% | 136 | 35% |
| 9 | Fujifilm | 182 | 13% | 147 | 24% |
| 10 | Hitachi | 166 | 11% | 124 | 34% |
| 11 | Commscope | 163 | 29% | 115 | 42% |
| 12 | Nikon | 154 | 56% | 150 | 3% |
| 13 | Sony | 143 | 5% | 122 | 17% |
| 14 | Seiko Epson | 139 | 10% | 184 | -24% |
| 15 | LG Display | 138 | 16% | 118 | 17% |
| 16 | International Business Machines | 128 | 1% | 126 | 2% |
| 17 | TCL | 123 | 21% | 248 | -50% |
| 17 | Valeo | 123 | 30% | 74 | 66% |
| 19 | AAC Technologies | 122 | 53% | 47 | 160% |
| 19 | Sharp | 122 | 14% | 98 | 24% |
For more detailed information about this technology area, or any other data related to the 2020 Patent 300®, please visit harrityllp.com/patent300/.