Electrical Circuits and Systems Ranks as the #2 Technology Area in the 2019 Patent 300™ Report
By Rocky Berndsen
The 2019 Patent 300™ Report details the top 300 companies, organizations, and universities obtaining patents in the United States. Data from the report shows that nearly 70% of the U.S. patents obtained in 2018 were for electrical, software, or computer-related technologies. The top 10 technology areas, which represent 49% of the 167,164 U.S. patents obtained by Patent 300 companies in 2018, are dominated by electrical technologies.
Chart 1 shows the Electrical Circuits and Systems technology area ranked 2rd largest in 2018. There were 13,215 patents issued for Patent 300 companies in the U.S. Electrical Circuits and Systems technology covers multiple United States Patent & Trademark Office (USPTO) technology classifications.
Included are electrical systems and devices, covering a broad spectrum of electrical and electromagnetic systems, devices, and circuitry, as well as electrical connectors.
Chart 1 – Top 10 Technology Areas for Patent 300 (2018 U.S. Patents)
| Rank | Patent 300 Technology Area | 2018 U.S. Patents | Percentage of Total 2018 U.S. Patents |
|---|---|---|---|
| 1 | Semiconductors/Memory | 15,153 | 9% |
| 2 | Electrical Circuits and Systems | 13,215 | 8% |
| 3 | Multiplex and VoIP | 9,875 | 6% |
| 4 | Optics | 9,003 | 5% |
| 5 | Printing/Measuring and Testing | 8,641 | 5% |
| 6 | Thermal & Combustion Technology, Motive & Fluid Power Systems | 7,017 | 4% |
| 7 | Selective Visual Display Systems | 4,855 | 3% |
| 8 | Telecommunications: Analog Radio Telephone; Satellite and Power Control; Transceivers, Measuring and Testing; Bluetooth; Receivers and Transmitters; Equipment Details | 4,761 | 3% |
| 9 | Computer Networks | 4,544 | 3% |
| 10 | Cryptography and Security | 4,311 | 3% |
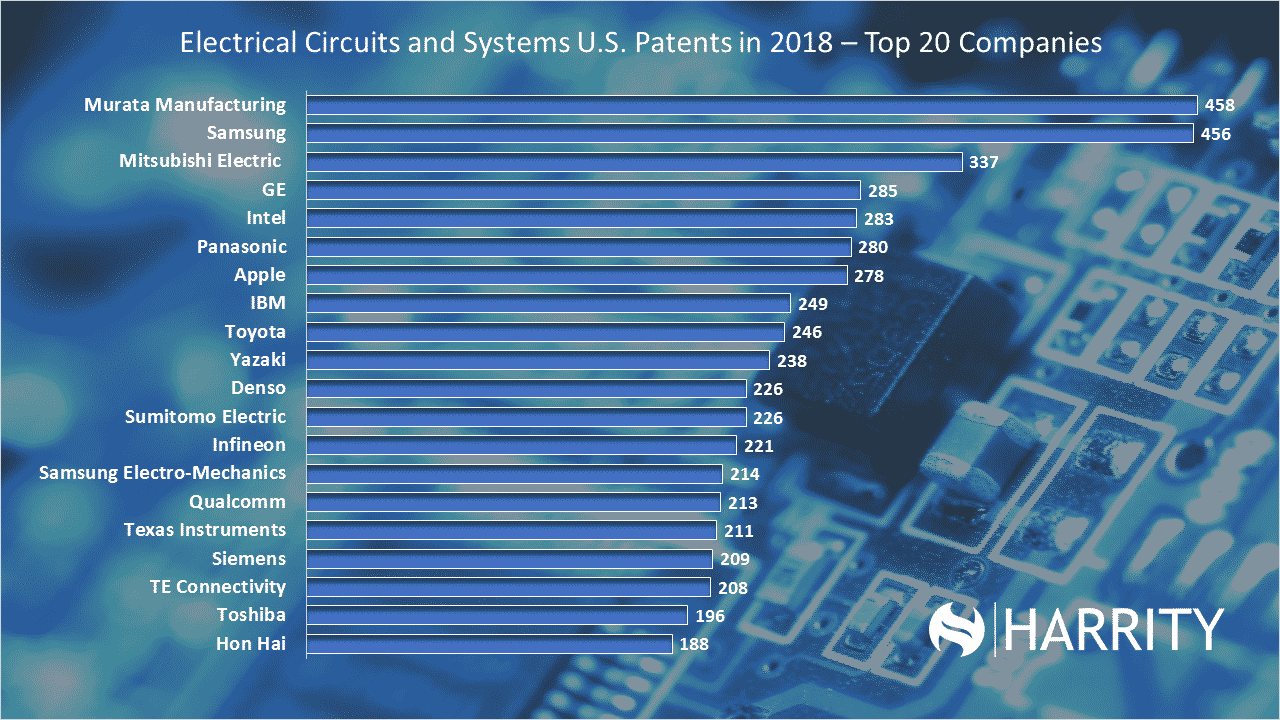
The top 20 companies in the Electrical Circuits and Systems area, shown in Chart 2. They include Murata (#1), Samsung (#2), Mitsubishi Electric (#3), GE (#4), and others. Murata tops the list having obtained 458 U.S. patents, up 6% from 2017. Samsung had 456 U.S. patents, down 11% from 2017. Mitsubishi Electric, at 337, was down 4% from 2017. The top 20 companies represent a cross-section of the technology sector. Included are device makers, chip makers, and auto makers, and various manufacturing companies.
Chart 2 – Top 20 Companies by U.S. Patents in Electrical Circuits and Systems
| Patent 300 Company Name | Patent 300 Rank | Patents 2018 | Percentage of 2018 Patents | Patents 2017 | Change from 2017 Patents |
|---|---|---|---|---|---|
| Murata Manufacturing | 1 | 458 | 61% | 432 | 6% |
| Samsung | 2 | 456 | 6% | 507 | -11% |
| Mitsubishi Electric | 3 | 337 | 28% | 349 | -4% |
| GE | 4 | 285 | 11% | 334 | -17% |
| Intel | 5 | 283 | 8% | 333 | -18% |
| Panasonic | 6 | 280 | 15% | 356 | -27% |
| Apple Inc. | 7 | 278 | 13% | 246 | 12% |
| IBM | 8 | 249 | 3% | 239 | 4% |
| Toyota | 9 | 246 | 10% | 200 | 19% |
| Yazaki | 10 | 238 | 73% | 272 | -14% |
| Sumitomo Electric | 11 | 226 | 47% | 248 | -10% |
| Denso | 12 | 226 | 19% | 273 | -21% |
| Infineon | 13 | 221 | 25% | 266 | -20% |
| Samsung Electro-mechanics | 14 | 214 | 65% | 178 | 17% |
| Qualcomm | 15 | 213 | 9% | 246 | -15% |
| Texas Instruments | 16 | 211 | 27% | 239 | -13% |
| Siemens | 17 | 209 | 15% | 231 | -11% |
| TE Connectivity | 18 | 208 | 67% | 246 | -18% |
| Toshiba | 19 | 196 | 12% | 152 | 22% |
| Hon Hai | 20 | 188 | 39% | 296 | -57% |
For more detailed information about this technology area, or any other data related to the 2019 Patent 300™ Report, please visit harrityllp.com/patent300/ or contact Rocky Berndsen directly via email at rberndsen@harrityllp.com.