Electrical Circuits and Systems Ranks as the #2 Technology Area in the 2020 Patent 300®
The 2020 Patent 300® details the top 300 companies, organizations, and universities obtaining patents in the United States. Data from the report shows that nearly 56% of patents obtained in the U.S. in 2019 were by Patent 300® companies. The top 10 technology areas, which represent 47% of the 189,796 U.S. patents obtained by Patent 300® companies in 2019, are again dominated by electrical technologies.
Chart 1 shows the Electrical Circuits and Systems technology area ranked 2nd largest in 2019, with 14,269 patents issued for Patent 300® companies in the US. Electrical Circuits and Systems technology covers multiple United States Patent & Trademark Office (USPTO) technology classifications.
Included are electrical systems and devices, covering a broad spectrum of electrical and electromagnetic systems, devices, and circuitry, as well as electrical connectors.
Chart 1 – Top 10 Technology Areas for Patent 300® (2019 U.S. Patents)
| Rank | Patent 300 Technology Area | 2019 U.S. Patents | Percentage of Total 2019 U.S. Patents |
|---|---|---|---|
| 1 | Semiconductors/Memory | 15841 | 8% |
| 2 | Electrical Circuits and Systems | 14269 | 8% |
| 3 | Multiplex and VoIP | 10824 | 6% |
| 4 | Printing/Measuring and Testing | 10383 | 6% |
| 5 | Optics | 9830 | 5% |
| 6 | Selective Visual Display Systems | 7338 | 4% |
| 7 | Thermal & Combustion Technology, Motive & Fluid Power Systems | 5951 | 3% |
| 8 | Computer Networks | 5753 | 3% |
| 9 | Cryptography and Security | 5016 | 3% |
| 10 | Telecommunications | 4714 | 2% |
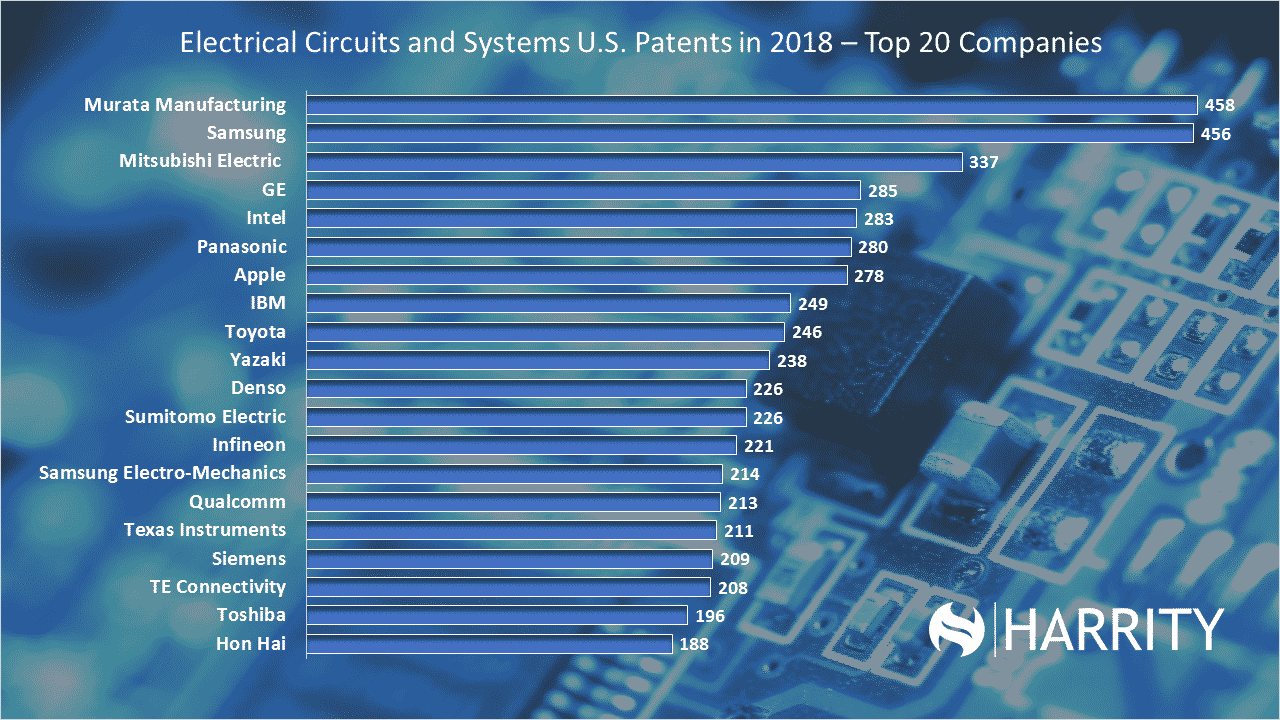
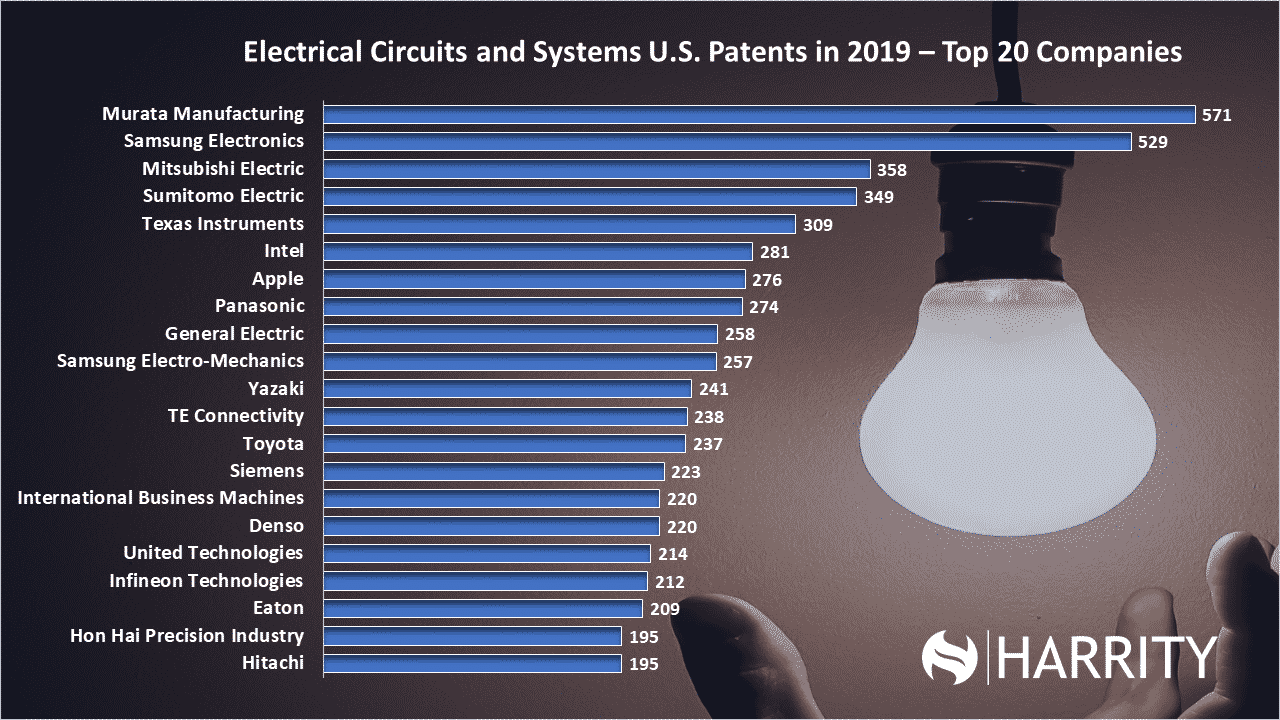
The top 20 companies in the Electrical Circuits and Systems area, shown in Chart 2, include Murata Manufacturing (#1), Samsung Electronics (#2), Mitsubishi Electric (#3), Sumitomo Electric (#4), and others. Murata again tops the list having obtained 571 US patents, up 25% from 2018. Samsung had 529 US patents, up 16% from last year. Mitsubishi Electric, at 358, was up 6% from 2018. The top 20 companies represent a cross-section of the technology sector. Included are device makers, chip makers, and auto makers, and various manufacturing companies.
Chart 2 – Top 20 Companies by U.S. Patents in Electrical Circuits and Systems
| Rank | Patent 300® | 2019 Electrical Circuits and Systems Patents | % of Company's 2019 US Patents | 2018 Electrical Circuits and Systems Patents | Change from 2018 Patents |
|---|---|---|---|---|---|
| 1 | Murata Manufacturing | 571 | 61% | 457 | 25% |
| 2 | Samsung Electronics | 529 | 6% | 456 | 16% |
| 3 | Mitsubishi Electric | 358 | 27% | 337 | 6% |
| 4 | Sumitomo Electric | 349 | 51% | 226 | 54% |
| 5 | Texas Instruments | 309 | 34% | 211 | 46% |
| 6 | Intel | 281 | 8% | 283 | -1% |
| 7 | Apple | 276 | 11% | 278 | -1% |
| 8 | Panasonic | 274 | 13% | 280 | -2% |
| 9 | General Electric | 258 | 9% | 285 | -9% |
| 10 | Samsung Electro-Mechanics | 257 | 67% | 214 | 20% |
| 11 | Yazaki | 241 | 64% | 238 | 1% |
| 12 | TE Connectivity | 238 | 74% | 208 | 14% |
| 13 | Toyota | 237 | 9% | 246 | -4% |
| 14 | Siemens | 223 | 14% | 209 | 7% |
| 15 | Denso | 220 | 18% | 226 | -3% |
| 15 | International Business Machines | 220 | 2% | 249 | -12% |
| 17 | United Technologies | 214 | 8% | 164 | 30% |
| 18 | Infineon Technologies | 212 | 25% | 221 | -4% |
| 19 | Eaton | 209 | 45% | 184 | 14% |
| 20 | Hitachi | 195 | 13% | 180 | 8% |
For more detailed information about this technology area, or any other data related to the 2020 Patent 300®, please visit harrityllp.com/patent300/.