Telecommunications Ranks as the #10 Technology Area in the 2020 Patent 300®
The 2020 Patent 300® details the top 300 companies, organizations, and universities obtaining patents in the United States. Data from the report shows that nearly 56% of patents obtained in the U.S. in 2019 were by Patent 300® companies. The top 10 technology areas, which represent 47% of the 189,796 U.S. patents obtained by Patent 300® companies in 2019, are again dominated by electrical technologies.
As shown in Chart 1, the Telecommunications technology area was the 10th largest technology area in 2019 with 4,714 patents issued for Patent 300® companies in the U.S. The Telecommunications technology area covers United States Patent & Trademark Office (USPTO) technology classifications related to communications systems in which electric or electromagnetic signals are used to transmit modulated carrier wave information between points. The transmission media is via radio wave generally of a frequency above human speech, yet at a frequency lower than infrared frequencies. Radiotelephonic communication via wireless link is included in this class.
Chart 1 – Top 10 Technology Areas for Patent 300® (2019 U.S. Patents)
Rank Patent 300 Technology Area 2019 U.S. Patents Percentage of Total 2019 U.S. Patents
1 Semiconductors/Memory 15841 8%
2 Electrical Circuits and Systems 14269 8%
3 Multiplex and VoIP 10824 6%
4 Printing/Measuring and Testing 10383 6%
5 Optics 9830 5%
6 Selective Visual Display Systems 7338 4%
7 Thermal & Combustion Technology, Motive & Fluid Power Systems 5951 3%
8 Computer Networks 5753 3%
9 Cryptography and Security 5016 3%
10 Telecommunications 4714 2%
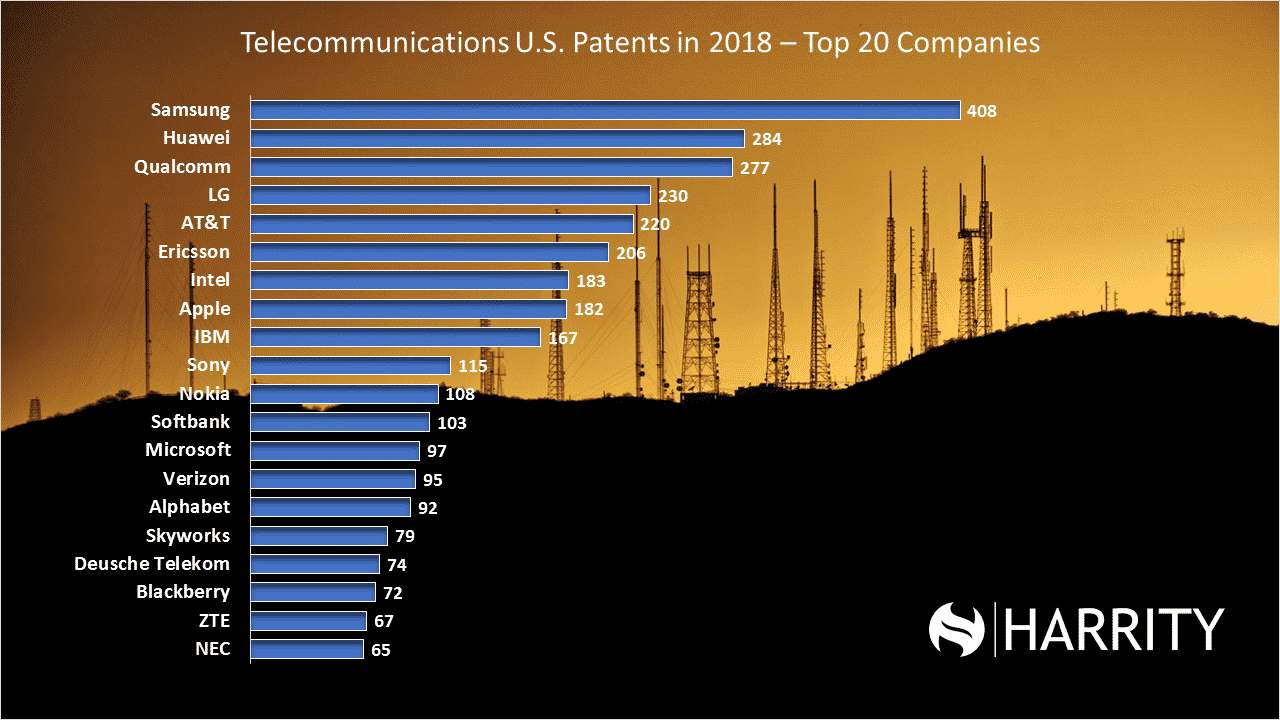
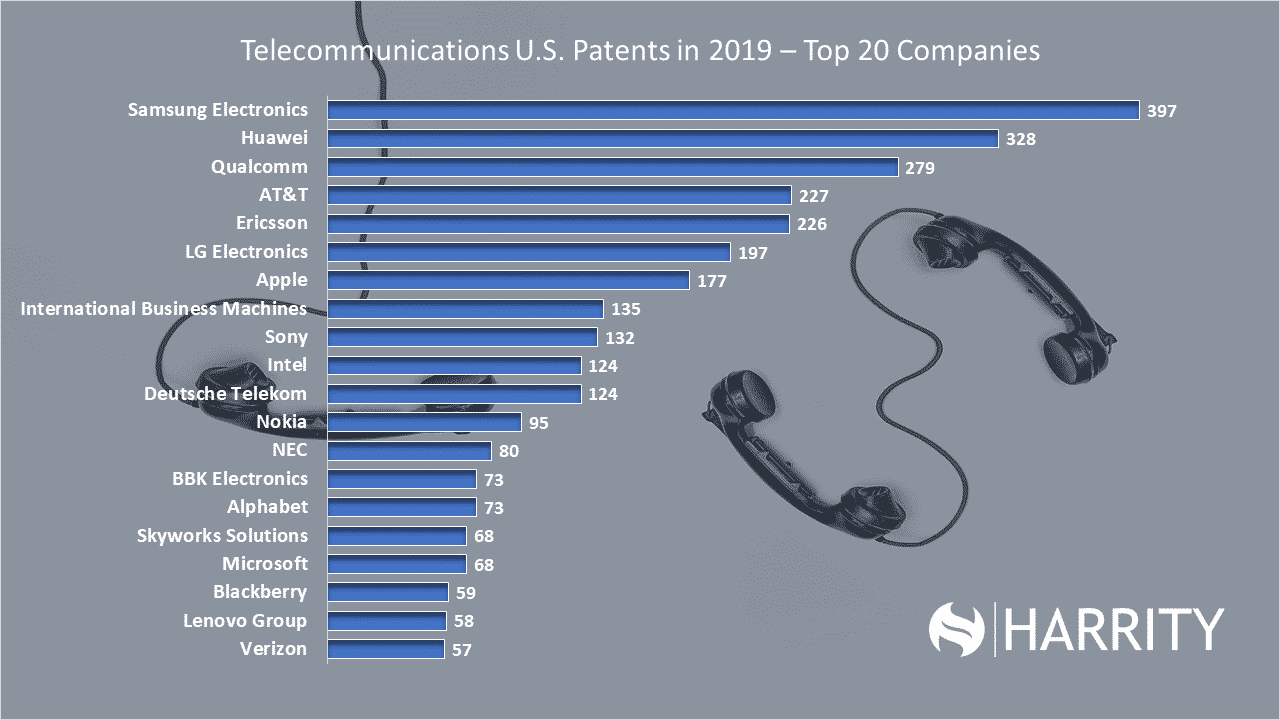
The top 20 companies in the Telecommunications area, shown in Chart 2, are large global technology companies. They include Samsung (#1), Huawei (#2), Qualcomm (#3), AT&T (#4) and others. Samsung tops the list having obtained 397 US patents, down slightly from 2018. Huawei had a 15% increase over 2018 at 328 US patents. Qualcomm, at 279, was up less than 1% from 2018. The top 20 companies represent a cross section of the technology sector. Included are device manufacturers, wireless carriers, and media companies.
Chart 2 – Top 20 Companies by U.S. Patents in Telecommunications
| Patent 300 Rank in Telecom | Patent 300 Company Name | Telecom Patents 2019 | % of Company’s 2019 U.S. Patents | Telecom Patents 2018 | Change from 2018 Patents |
|---|---|---|---|---|---|
| 1 | Samsung Electronics | 397 | 5% | 408 | -3% |
| 2 | Huawei | 328 | 11% | 284 | 15% |
| 3 | Qualcomm | 279 | 12% | 277 | 1% |
| 4 | AT&T | 227 | 16% | 220 | 3% |
| 5 | Ericsson | 226 | 14% | 206 | 10% |
| 6 | LG Electronics | 197 | 7% | 230 | -14% |
| 7 | Apple | 177 | 7% | 182 | -3% |
| 8 | International Business Machines | 135 | 1% | 167 | -19% |
| 9 | Sony | 132 | 5% | 115 | 15% |
| 10 | Deutsche Telekom | 124 | 44% | 74 | 68% |
| 10 | Intel | 124 | 3% | 183 | -32% |
| 12 | Nokia | 95 | 11% | 108 | -12% |
| 13 | NEC | 80 | 8% | 65 | 23% |
| 14 | Alphabet | 73 | 3% | 92 | -21% |
| 14 | BBK Electronics | 73 | 20% | 18 | 306% |
| 16 | Microsoft | 68 | 2% | 97 | -30% |
| 16 | Skyworks Solutions | 68 | 24% | 79 | -14% |
| 18 | Blackberry | 59 | 17% | 72 | -18% |
| 19 | Lenovo Group | 58 | 9% | 42 | 38% |
| 20 | Verizon | 57 | 9% | 95 | -40% |
For more detailed information about this technology area, or any other data related to the 2020 Patent 300®, please visit harrityllp.com/patent300/.