2020 Top Patent Firms List Announced

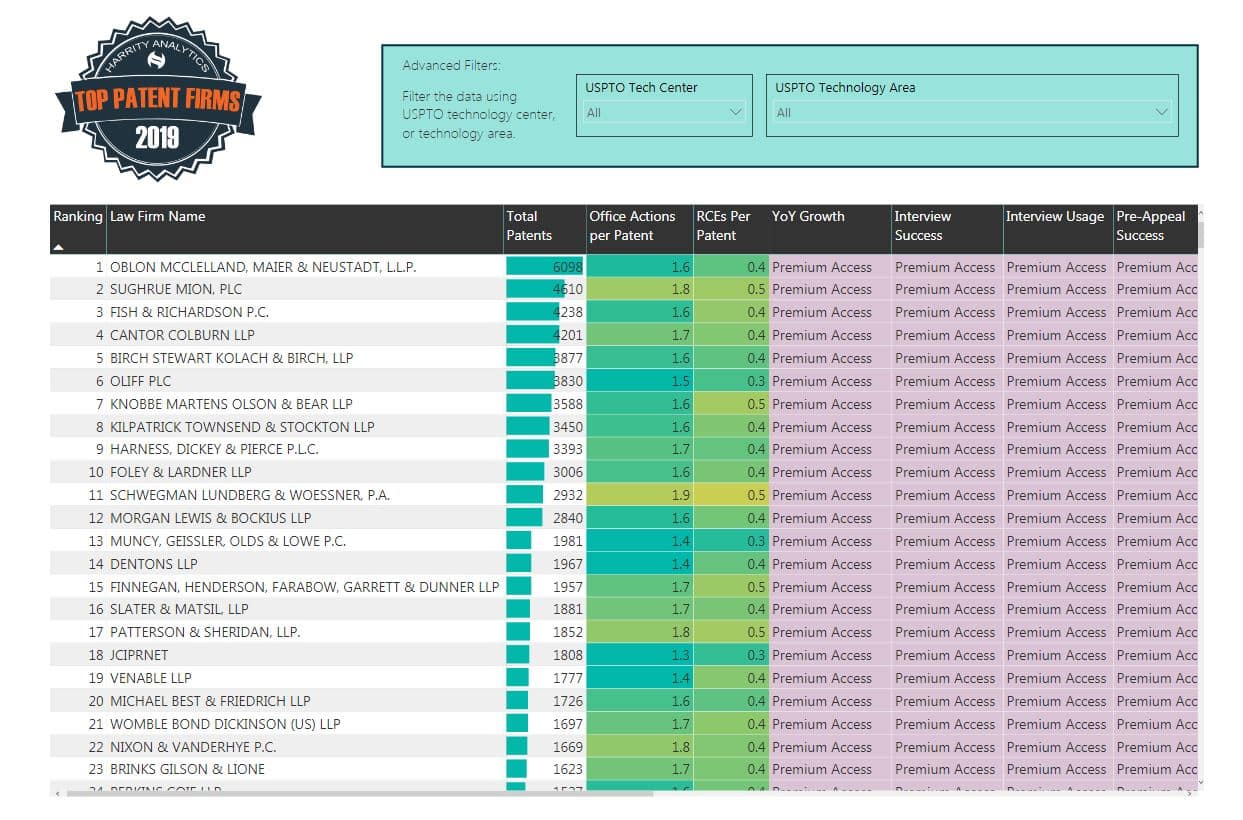
WASHINGTON (January 15, 2021) –  Harrity Patent Analytics is pleased to announce the release of the 2020 Top Patent Firms list. The list, published annually, ranks industry-leading patent law firms based on the total number of U.S. utility patents issued in the past year and contains exclusive prosecution metrics. 

The 2020 Top Patent Firms list incorporates notable differences from last year’s rankings, including the year-over-year change in the quantity of patents firms obtained from 2019 to 2020.  Rocky Berndsen, Head of Patent Analytics, says of these changes, “You can see which patent firms are making big moves up and down in our field.  The impact of a firm merger or one or more partners leaving a firm can be seen in the data.  Law firms and companies are using the prosecution data from last year’s patents to make strategic decisions in their practice”.

The Top Patent Firms list is accompanied by an interactive dashboard and includes patent firms that have obtained at least 50 U.S. utility patents where the patent firms are listed on the front of the utility patents. Company legal departments have not been eliminated from the list.  The full list is available here.

About Harrity Patent Analytics 

Harrity Patent Analytics, an analytical team within the boutique IP law firm of Harrity & Harrity, LLP, uses cutting-edge capabilities to analyze patent data and extract insights for clients to use when making strategic decisions regarding patent portfolios.  Patent 300® companies rely on Harrity Patent Analytics services to understand their patent portfolios, the patent portfolios of their competitors, and patent office trends around the world.  For more information, visit harrityllp.com/services/patent-analytics/. 


The Importance of Patent Analytics for Your Business Strategy

When a company or organization launches a new product, a patent is usually the first published evidence of the invention in the public domain. Patents are essential protections for any innovation-driven company that has a substantial Intellectual Property Rights (IPR) culture.

A patent protects the right of the inventor company to use their product, thereby preventing others from using the invention. Today, patents have become critical factors for businesses to get an edge over their competitors. Patent analytic tools are being used by organizations for various purposes, including development of sound business strategy.

How Does Patent Analytics Help Businesses?

Patent analysis helps businesses in many areas, both internally and externally. For instance, internal patent analytics helps organizations assess their own patent portfolio.

Further, it can assist in SWOT (strengths, weaknesses, opportunities, and threats) analysis. With patent analytics, companies can make informed decisions regarding licensing and acquisition of advanced technologies.

External analytics, on the other hand, provides information about competitors and the technologies they use.

Let’s discuss the benefits of patent analytics for business strategies in detail.

1.     Portfolio Analytics

To stand out amongst the competition, you must understand your organization’s patent portfolio. Analyzing your company’s portfolio reveals valuable insights; you get a clear picture of your strengths and weaknesses. Doing so allows you to make well-informed business decisions.

2.     Competitor Analytics

Another advantage of patent analysis is that it allows you to compare your own patent portfolio to those of competitors. Competitor analytics offers valuable insight into competitor business strategies and partnerships.  Patent analytics helps you understand what is working for your competitors and what mistakes you should avoid.

3.     Technology Analytics

Analytics tools keep you up to date on where your business and competitors stand in the dynamic landscape of technology. This information allows you to make better decisions regarding portfolio management and fosters stronger client relationships.

Field-relevant technology know-how helps identify market needs. Patent analysis provides researchers and inventors with valuable technological information needed to find innovative solutions to technical problems.

Additionally, patent analytics helps with licensing, mergers, and acquisitions. Patent data can provide a comprehensive, technical portfolio view for technologies and companies in consideration for licensing or acquisition and helps shorten the list of choices.

4.     Cost and Budget Analytics

Budgeting and wise resource-management is crucial to strong business strategy. Analytics provide detailed information on costs occurred during patent prosecution and maintenance periods. This information helps identify problems, cut costs, and spend your budget efficiently.

5.     Automated Portfolio Categorization

Patent portfolio categorization dashboards, such as those created by Harrity Analytics, are automated systems that categorize patent portfolios according to your business’s self-determined technology areas.  These tools can additionally perform a competitive analysis of the key players in your niche industry areas.

Final Words

Whether you are starting a new business, developing a new product, pitching a new client, planning a merger, or just trying to stay ahead of the competition, patent analytics is crucial to ensuring you are on the right track and building a sound business strategy.

Harrity Patent Analytics services can help you manage your patent profile, gain insight into your competitors’ portfolios, and understand patent trends around the world.  Harrity Patent Analytics can help you make patent prosecution decisions and refine your business strategy.  To view a list of Harrity Patent Analytics services or request your own customized reports, visit https://harrityllp.com/services/patent-analytics/.


About Harrity Patent Analytics

Harrity Patent Analytics, a team of professionals within the boutique IP law firm of Harrity & Harrity, LLP, uses cutting-edge capabilities to analyze patent data and extract insights for strategic decisions regarding patent portfolios.  Patent 300® companies rely on Harrity Patent Analytics services to better understand their own patent portfolios, those of their competitors, their key technology areas, and to keep track of patent office trends around the world.  For more information, visit harrityllp.com/services/patent-analytics.


Patent 300® Report Ranks Most Innovative Companies

WASHINGTON (February 13, 2020) Harrity Patent Analytics has released the much-anticipated publication of the annual Patent 300®.  The Patent 300® is a distinctive compilation of the top 300 companies, organizations, and universities in the patent field, based on quantities of issued U.S. utility patents.  It is considered the intellectual property industry’s premier resource for patent insight and competitive intelligence on the world’s leaders in technology.

Ranging from tech giants, such as IBM (#1) and Samsung (#2), to leading universities, like University of California (#67) and MIT (#121), and newcomers, including Nielsen (#207) and Pure Storage (#341), the Patent 300® represents 54 percent of the more than 350,000 U.S. utility patents issued in 2019.

Key findings and trends from the Patent 300® include:

  • A few notable mergers and divestitures occurred among Patent 300® companies in 2019:
    • IBM acquired Red Hat, further securing their place at the top of the list
    • Broadcom (#83) acquired CA, Inc., jumping from #118 last year to #83
    • Commscope (#89) acquired Arris, boosting them from #133 last year to #89
    • DowDuPont, #38 on the previous Patent 300® list, split into Dow (#96), DuPont (not ranked), and Corteva (#92)
  • Capital One (#79) jumped 127 spots on the list, more than tripling their issued patents from the previous year
  • 27 previously unranked organizations joined the Patent 300®, including Bristol Myers Squibb (#150), Tata Sons (#264), and Splunk (#269)
  • 20 previously ranked organizations dropped off the list, including Uber, Nintendo, and Symantec

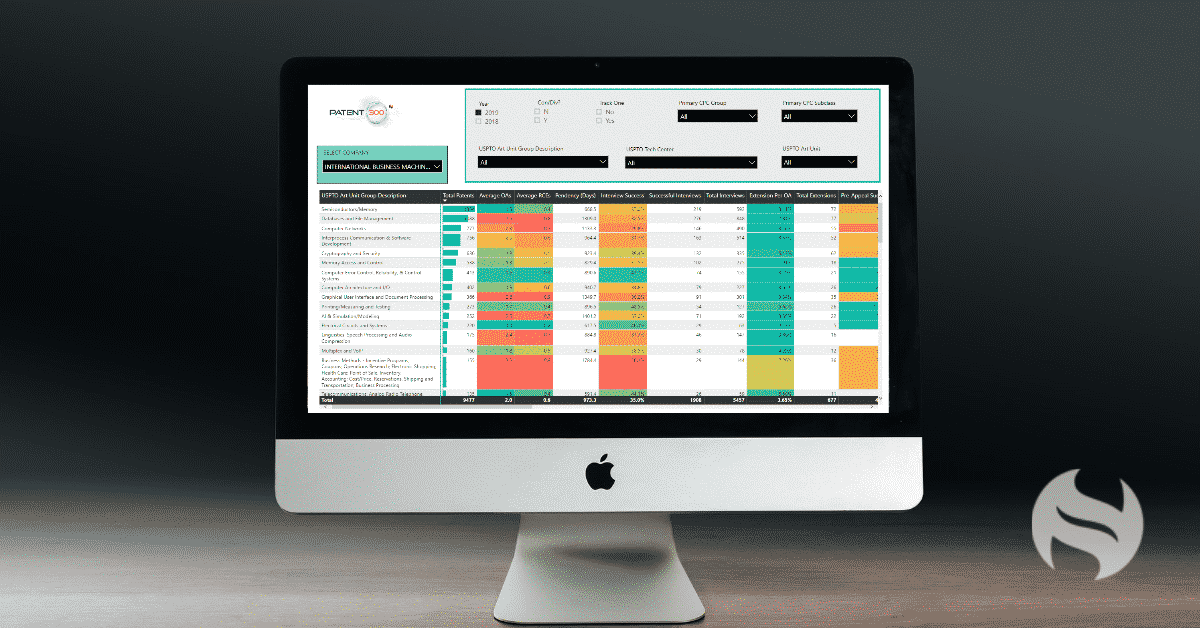
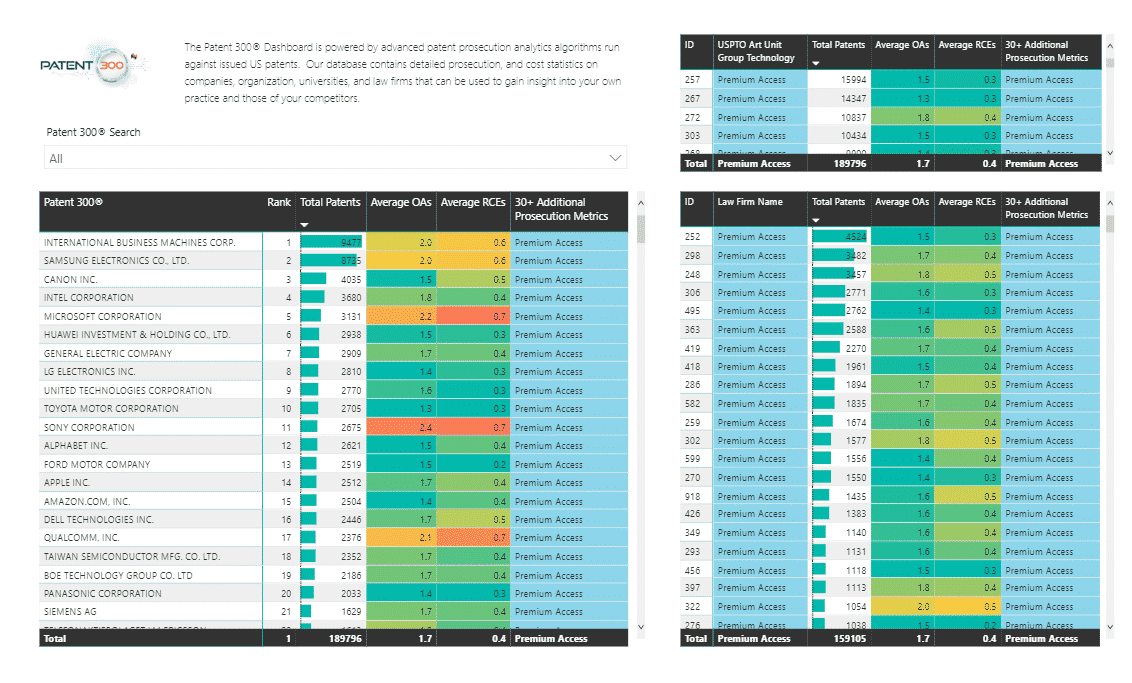
This year’s Patent 300® includes an interactive dashboard in which users can filter data by technology area, art unit, and more.  The addition of this feature will allow in-house counsel, law firm partners, marketing professionals, and c-suite executives to quickly generate insight into patent portfolios, competitors, and technology areas.

“The interactive Patent 300® dashboard is an exciting new addition to the Patent 300® this year”, says Rocky Berndsen, Head of Patent Analytics at Harrity.  “This tool gives you the ability to easily find detailed patent prosecution metrics on thousands of companies and law firms with a few clicks of the mouse.”

The ranking of the top 300 companies, organizations and universities and interactive dashboard can be found HERE.

Access to the Patent 300® Premium Interactive Dashboard is available upon request.

About Harrity Patent Analytics

Harrity Patent Analytics, a team of professionals within the boutique IP law firm of Harrity & Harrity, LLP, uses cutting-edge capabilities to analyze patent data and extract insights for strategic decisions regarding patent portfolios.  Patent 300® companies rely on Harrity Patent Analytics services to better understand their own patent portfolios, those of their competitors, their key technology areas, and to keep track of patent office trends around the world.  For more information, visit harrityllp.com/services/patent-analytics.


top patent firms

2019 Top Patent Firms List Announced

WASHINGTON (January 14, 2020) – Harrity Patent Analytics is pleased to announce the publication of its annual list of top patent law firms.  The 2019 Top Patent Firms” list ranks industry leading patent law firms based on the total number of U.S. utility patents issued in 2019. 

The 2019 Top Patent Firms list comes with some significant changes from years prior, including an interactive dashboard and exclusive metrics.  We have collected and analyzed data on more than 300,000 patents obtained by over 3000 different law firms, which we have turned into an interactive online dashboard that allows users to filter data by firm, technology area, and USPTO technology center.  This gives both patent law firms and Patent 300 companies a better understanding of who is obtaining the most patents in the U.S.,” explains Rocky Berndsen, Head of Patent Analytics at Harrity.  “We are also offering premium analytics that delve deeper into detailed patent prosecution metrics, giving law firms and Patent 300™ companies more insights into the robust analytics of specific law firms.” 

The Top Patent Firms dashboard includes patent firms that have obtained at least 50 U.S. utility patents where the patent firms are listed on the front of the utility patents. Company legal departments have not been eliminated from the list.  The full list is available here.

About Harrity Patent Analytics 

Harrity Patent Analytics, an analytical team within the boutique IP law firm of Harrity & Harrity, LLP, uses cutting-edge capabilities to analyze patent data and extract insights for clients to use when making strategic decisions regarding patent portfolios.  Patent 300™ companies rely on Harrity Patent Analytics services to understand their patent portfolios, the patent portfolios of their competitors, and patent office trends around the world.  For more information, visit harrityllp.com/services/patent-analytics/. 


Getting To Know Your Patent Examiner Through Data

Law360 (June 13, 2019) — How many office actions should I expect at the U.S. Patent and Trademark Office? Should I file a request for continued examination or a notice of appeal? Is it worth filing a pre-appeal?

These, among others, are common questions that practitioners may ask themselves during patent prosecution. In the past, these were mostly questions that could not be answered by taking into account unique proclivities of different examiners. Now, using data analytics, we can get a better sense of how prosecution will go and be able to make an informed decision when a crossroad is reached.

Below, we will explore how to use public data about an examiner, provided by the USPTO, during patent prosecution.

Allowance Rate

By looking at an examiner’s allowance rate (i.e., allowance vs. abandonments), we can get a sense of the journey early on. A high allowance rate is an indicator that the examiner likely has no qualms about allowing applications, and that the examiner likely will not stubbornly stick to poor rejections. For these types of examiners, if appropriate, it may be worth taking a more assertive initial position, including arguing that the rejections should be withdrawn, or offering modest amendments.

However, if the examiner’s allowance rate is low, you may want to consider including substantial amendments or anticipate the possible need to file an appeal as these types of examiners tend to combine three, four, or even five-plus references in their art rejections. If the allowance rate in the art unit is significantly higher than the examiner’s allowance rate, you may want to consider getting the examiner’s supervisor or a primary examiner in the art unit involved early in the process as it may be easier to reach an agreement with them than with the assigned examiner.

Office Actions Per Patent, RCEs Per Patent

A high office action per patent and/or RCE per patent rate may be an indication that reaching allowability will be challenging. These types of examiners also are likely unafraid to combine three, four or five-plus references to make their art rejections. Similar to examiners with low allowance rates, you may want to consider including substantial amendments, getting the supervisory examiner or a primary examiner involved, or planning to file an appeal. You may even want to check the supervisory examiner’s and primary examiner’s allowance rates when deciding whether to get one of them involved.

Interview Statistics

Generally speaking, it is beneficial to interview an examiner as it gives a practitioner an opportunity to get a better sense of the examiner’s interpretations of the application and the applied references, and a chance to explain the invention.

A high interview success rate (i.e. the rate that interviews lead to an allowance in the next office action) may be an indicator that the examiner uses interviews for compact prosecution. These examiners are likely willing to provide suggestions for amendments that would lead to allowance or at least advance prosecution. For these types of examiners, you may want to be prepared to discuss multiple, different types of amendments to take advantage of their willingness to expedite prosecution. However, if the interview success rate is low for the examiner, consider sending a substantive interview agenda with proposed amendments to maximize the chance of reaching an agreement with the examiner.

A comparison of an examiner’s final rejection allowance rate with After Final Consideration Pilot and his/her final rejection allowance rate without AFCP may be an indicator of whether the examiner takes the AFCP program seriously. If there is a significant difference with those rates, the examiner likely uses the allocated two to three hours in the AFCP program to find a way to allow the application. For these types of examiners, consider filing an after-final amendment with an AFCP request before deciding whether to file an RCE or a notice of appeal. However, if the rates are similar, the examiner likely uses pre-pilot procedures regardless of whether an AFCP is filed.

Pre-Appeal Statistics

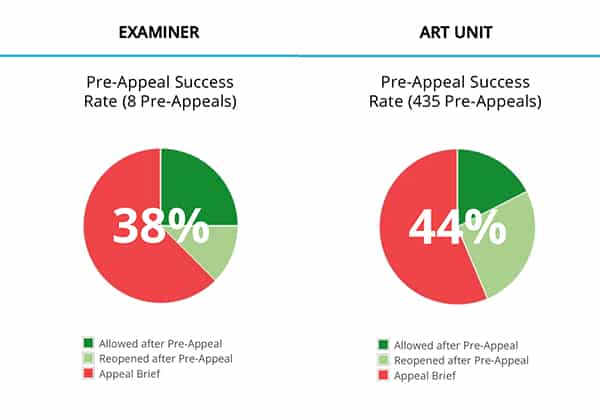
Pre-appeal statistics can be useful when deciding whether to file an appeal brief or a pre-appeal brief. A high rate of allowance and/or re-opening of prosecution when pre-appeals are filed may indicate that the examiner, the examiner’s SPE, and other panel members in the examiner’s art unit take the pre-appeals process seriously and that it is worth presenting arguments in a pre-appeal brief. However, a low rate of allowance and a low rate of reopening of prosecution after pre-appeal may indicate that it would be better to forego the pre-appeal process and go straight to appeal or go another round with an RCE.

Appeal Statistics

Analyzing an examiner’s appeal statistics may be useful in determining whether to file an appeal or an RCE. If the examiner’s rate of allowance after an appeal is filed is high, it may be worth appealing rather than filing an RCE and avoid narrowing claims unnecessarily. However, if the examiner’s rate of allowance after appeal is low, it is highly likely that your appeal will go to the Patent Trial and Appeal Board.

Since it may take a couple of years for the PTAB to pick up your appeal due to their backlog, you may want to make certain that your client is comfortable with going through with the appeals process and waiting rather than filing an RCE and possibly reaching an agreement with the examiner earlier. For these types of examiners, you may want to consider the examiner’s allowance rate and RCEs per patent rate to help you and your client in making this decision.

If the examiner’s board decision success rate is high, it may be an indication that the examiner goes to the board only when he/she believes that his/her examiner’s answer would be particularly strong. If you receive a compelling examiner’s answer from these types of examiners, consider filing an RCE rather than going to the board.

Conclusion

Just like how data analytics has improved efficiency in other industries, examiner analytics has the potential to improve the efficiency of patent practitioners and patent prosecution. Therefore, using examiner data in your practice may lead to better, quicker and cheaper outcomes for you clients.

By Kris Rhu

The example screenshots in this article are from Patentprufer, which was developed by Harrity & Harrity.