The Pencil Test

How Reliable is the Pencil Test for Expediting the Patent Prosecution Process?

By Nathan Phares, Associate

Many patent practitioners and Examiners have spoken of the “pencil test,” which suggests that an independent claim is more likely to be rejected or is rejected as a matter of course if the claim is shorter than a pencil laid upon the claim.  Some point to the pencil test as a useful rule of thumb and suggest “padding” the length of the independent claim in hopes of improving the outcomes of prosecution.  However, drafting a lengthy independent claim may unnecessarily narrow the scope of the claim.  Does the length of the independent claim truly impact prosecution outcomes, or is the pencil test a myth?  We’ve analyzed the data, and we provide our conclusions below.

The data set we created for this analysis includes all patents that issued from applications filed post-AIA.  We limited the scope of the data set to electrical, mechanical, chemical, and biotech tech centers (i.e., Tech Centers 1600, 1700, 2100, 2400, 2600, 2800, 3600, and 3700).  For each patent, the data set indicates the number of Office Actions (OAs), the Art Unit and Tech Center, the length of claim 1 in total words and unique words, the length of the specification, and various other data (e.g., number of RCEs, Assignee, Agent, pendency, and so on).  We didn’t filter for unusually long or short claims – the longest claims (topping out at over 8,000 words!) and the shortest claims seem to generally be legitimate.

According to the data, first-OA allowances are slightly more likely with a longer independent claim than with a shorter independent claim, suggesting that the pencil test may be a factor in first-OA allowances.  Figure 1 shows a chart of the average number of total words in Claim 1 for buckets of the number of OAs.  First-OA allowances, which are associated with zero OAs, have a slightly longer first claim on average than second-OA allowances.  This relationship holds across all the Tech Centers we analyzed except TC 1600.  Figure 2 shows a chart of the average number of unique words in Claim 1.  In Figure 2, the same impact is present but is far less pronounced, indicating that total word count is more strongly correlated with first-OA allowance than unique word count.


Figure 1


Figure 2

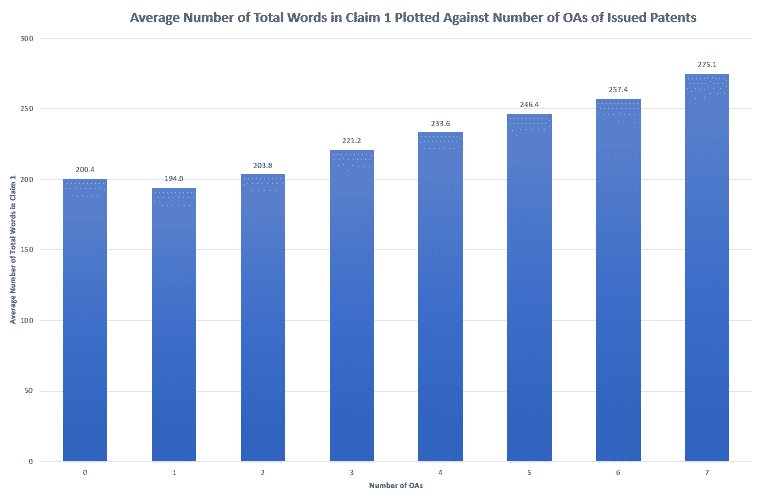
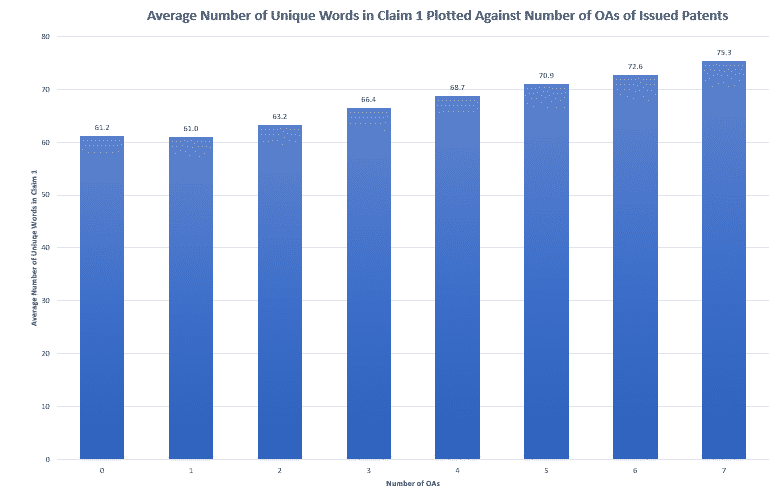
The pencil test seems not to predict outcomes other than first-OA allowances: as the number of OAs before allowance increases, so does the length of claim 1.  This is the opposite of what the pencil test would suggest and may reflect the tendency to amend features into claim 1 over the course of prosecution in pursuit of allowance.

As the data shows, independent claims that include more total words tend to receive better treatment at the outset of prosecution, but outcomes are not clearly impacted by the pencil test as prosecution continues.  Therefore, the patent drafter should consider lengthening the independent claim if a first-OA allowance is the goal.  However, the data shows that the impact of the pencil test is mild at best, so the drafter should not rely on claim length alone to carry the day.  For example, the art unit where the application is assigned is a powerful predictor of the efficiency of the patent prosecution.  Therefore, the drafter should consider how the language used in the application may impact the assignment of the art unit.

It is important to note the limitations of the data set.  First, the claim lengths shown above are claim lengths of the issued patent, not of the patent application when it is first examined.  Thus, it is hard to tell whether the correlation between claim length and length of prosecution is due to the amendment of features into claim 1.  Second, we omitted patents associated with 8 or more OAs from the charts above, since the data set gets quite sparse after 7 OAs – for example, the 10, 11, 12, and 13 OA buckets collectively represent only 59 patents.  However, the trend shown in Figures 1 and 2 continues through the 9 OA bucket.

Matthew Allen, Harrity Team

Statements in Specification May Harm Patent Eligibility

By Matthew Allen, Associate

The Federal Circuit recently issued a decision that indicates how certain types of statements, made in an Applicant’s own specification, can undermine patent eligibility.  Specifically, in Solutran Inc. v. Elavon, Inc., U.S. Bancorp, 2019-1345, (Fed. Cir. Jul. 30, 2019) (“Solutran”), the Federal Circuit highlights how patent eligibility under 35 U.S.C. §101 might turn based on a specification’s background information and statements regarding proposed advancements, or benefits, of an invention .

At issue in Solutran is claim 1 of U.S. Patent No. 8,311,945 (’945 patent), which recites:

A method for processing paper checks, comprising:

a) electronically receiving a data file containing data captured at a merchant s point of purchase, said data including an amount of a transaction associated with MICR information for each paper check, and said data file not including images of said checks;

b) after step a), crediting an account for the merchant;

c) after step b), receiving said paper checks and scanning said checks with a digital image scanner thereby creating digital images of said checks and, for each said check, associating said digital image with said check s MICR information; and

d) comparing by a computer said digital images, with said data in the data file to find matches.

When analyzing the claim under part one of the Supreme Court’s Alice test, the Federal Circuit determined that claim 1 was “directed to the abstract idea of crediting a merchant’s account as early as possible while electronically processing a check.”  In making its determination, the court examined the purported benefits of the ‘945 patent.  Two benefits were identified in the specification: “improved funds availability,” and “outsourcing.”  However, the court noted that while two benefits were identified in the specification, the claims were not limited to an embodiment that resulted in both benefits, stating that “[t]he only advance recited in the asserted claims is thus crediting the merchant’s account before the paper check is scanned.”  In other words, because the claims did not include features that required “outsourcing,” the court considered the only relevant benefit to be “improved funds availability.”

The court determined that the claimed advance (“improved funds availability”) was similar to abstract concepts such as “hedging” and “mitigating settlement risk,” and that “[t]he desire to credit a merchant’s account as soon as possible is an equally long standing commercial practice.”  Thus, the Federal Circuit used the purported advance of the ‘945 patent, as indicated in the specification and supported by the claims, in determining that claim 1 was directed to an abstract idea.  The court also noted that its characterization of claim 1 was appropriate where “the abstract idea tracks the claim language and accurately captures what the patent asserts to be the ‘focus of the claimed advance over the prior art.’”  This further signifies the importance the court placed on the alleged benefits of the application.

When addressing step two of the Alice test, the Federal Circuit used the background of the ‘945 patent against the patentee by stating that “the background of the ’945 patent describes each individual step in claim 1 as being conventional. Reordering the steps so that account crediting occurs before check scanning (as opposed to the other way around) represents the abstract idea in the claim, making it insufficient to constitute an inventive concept.”  In other words, simply re-ordering admittedly known steps will not constitute an inventive concept for purposes of step two of the Alice test.  Thus, the court used the applicant’s own statements in the specification, indicating that certain steps are conventional, to find that the claim was not patent eligible.

This decision provides important lessons about drafting and prosecuting a patent application that may increase the application’s likelihood to survive a §101 challenge.  First, practitioners should make sure that benefits identified in a patent application are exhibited in the claimed embodiments.  The identified benefits should ideally be clearly technical.  Second, practitioners should ensure that the patent application does not include any statements that might be used to argue against the patent eligibility of the claims.  This may include considering whether a detailed background may do more harm than good.

Top 20 Semiconductor and Energy Companies US 2018

Semiconductors and Memory Ranks as the #1 Technology Area in the 2019 Patent 300™ Report

By Rocky Berndsen

The 2019 Patent 300™ Report details the top 300 companies, organizations, and universities obtaining patents in the United States.  Data from the report shows that nearly 70% of the U.S. patents obtained in 2018 were for electrical, software, or computer-related technologies.  The top 10 technology areas, which represent 49% of the 167,164 U.S. patents obtained by Patent 300 companies in 2018, are dominated by electrical technologies.

Chart 1 shows the Semiconductors and Memory technology area ranked highest in 2018.  There were 15,153 patents issued for Patent 300 companies in the U.S.  Semiconductors and Memory technology covers multiple United States Patent & Trademark Office (USPTO) technology classifications.  Included are processes for manufacturing semiconductors and solid-state devices.  Also included are processes and apparatus for addressing, accessing and controlling, and forming memory addresses in a computer or digital data processing system.

Chart 1 – Top 10 Technology Areas for Patent 300 (2018 U.S. Patents)

RankPatent 300 Technology Area2018 U.S. PatentsPercentage of Total 2018 U.S. Patents
1Semiconductors/Memory15,1539%
2Electrical Circuits and Systems13,2158%
3Multiplex and VoIP9,8756%
4Optics9,0035%
5Printing/Measuring and Testing8,6415%
6Thermal & Combustion Technology, Motive & Fluid Power Systems7,0174%
7Selective Visual Display Systems4,8553%
8Telecommunications: Analog Radio Telephone; Satellite and Power Control; Transceivers, Measuring and Testing; Bluetooth; Receivers and Transmitters; Equipment Details4,7613%
9Computer Networks4,5443%
10Cryptography and Security4,3113%

The top 20 companies in the Semiconductors and Memory area, shown in Chart 2, include Taiwan Semiconductor (#1), Samsung (#2), IBM (#3), Micron (#4), and others.  Taiwan Semiconductor tops the list having obtained 1,972 U.S. patents, up slightly from 2017.  Samsung had 1,522 U.S. patents, down nearly 15% from 2017.  IBM, at 1,318, was up slightly from 2017.  The top 20 companies represent a cross-section of the technology sector.  Included are chip makers, device makers, and various electronics companies.

Chart 2 – Top 20 Companies by U.S. Patents in Semiconductors and Memory

Patent 300 Company NamePatent 300 Rank in Semiconductors and MemorySemiconductor and Memory Patents 2018% of Company’s 2018 U.S. PatentsSemiconductor and Memory Patents 2017Change from 2017 Patents
Taiwan Semiconductor1197279%18934%
Samsung2152219%1744-15%
IBM3131814%12714%
Micron464569%55614%
Mubadala Investment559372%687-16%
Semiconductor Energy Lab647855%587-23%
SK Hynix746858%652-39%
Toshiba Memory841960%468-12%
Infineon939245%505-29%
BOE1038724%451-17%
Intel1137711%481-28%
Renesas1232055%365-14%
United Microelectronics1331893%326-3%
STMicroelectronics1424935%2288%
TCL1523024%16727%
LG Display1622433%2164%
Western Digital1721529%330-53%
Sony181979%1847%
Texas Instruments1917822%212-19%
Fuji Electric2017652%12827%

For more detailed information about this technology area, or any other data related to the 2019 Patent 300™ Report, please visit harrityllp.com/patent300/ or contact Rocky Berndsen directly via email at rberndsen@harrityllp.com.

Patent 300™ Automotive Sector by 2018 US Patents

Toyota Tops Auto Market in Patent 300™

By Rocky Berndsen

Big head, long tail.  This isn’t the description of an exotic animal, rather it describes the automotive sector of the Patent 300™.  The top 25 auto companies and parts makers obtained more than 14,000 utility patents in 2018, but the top five obtained 60% of them.

The report, which details the top 300 companies, organizations, and universities receiving utility patents in the U.S. last year, shows that the top 25 companies in the automotive space were awarded patents in a variety of areas, from the expected (Surface Transportation for Honda, Ford and GM) to the unexpected (Wells, Earth Boring/Moving for BMW, Magna and Schaeffler).

Toyota leads the pack with 2,554 patents obtained in 2018.  It is the No. 6 company in the Patent 300™ overall and has a leading position in several patent areas. The Japanese car maker is No. 1 in both Computerized Vehicle Controls and Fuel Cells and Batteries. It holds the No. 2 position in three areas: Surface Transportation; Material and Article Handling; and Static Structures, Supports and Furniture. It ranks No. 4 in Thermal & Combustion Technology, the area where it holds the highest number of its 2018 patents.

Ford is in second place with 2,149 patents and bests its rival, Toyota, to hold the No. 1 spot in both Surface Transportation and Static Structures, Supports and Furniture.  It holds the No. 2 spot in Computerized Vehicle Controls and in Vehicles and System Alarms.  It had most of its 2018 patents in Thermal & Combustion Technology, where it holds the No. 3 spot.  It is No. 15 overall in the Patent 300™.

South Korean car maker Hyundai rounds out the list at No. 3 with 1,539 patents.  It holds the No. 1 position in Material and Article Handling, the No. 3 position in Computerized Vehicle Controls and the No. 5 position in both Surface Transportation and Thermal & Combustion Technology.  Hyundai sits at No. 22 in the Patent 300™.

Those who follow the automotive field will recognize that the car makers’ rankings in the top three mirror their positions in Computerized Vehicle Controls, an area that includes utility patents for things that can control the direction and speed of a car, and controls for autonomous vehicles.  This is no coincidence, as cars become more and more automated and as the market moves toward autonomous vehicles.

Patent 300 Automotive Top 25

Parts manufacturers make up the other portion of the sector, including tire companies that are household names: Continental (9), Bridgestone (15), Sumitomo (16), and Michelin (23). These companies share top spots in the Tires technology area, including Sumitomo at No. 2, Bridgestone at No. 3, Michelin at No. 4.  In case you’re wondering, the No. 1 in this area, which includes adhesive bonding and plastic molding, is a company that tends to focus on much larger vehicles than others in the automotive space, namely Boeing, No. 32 in the Patent 300™.

The overall picture of the industry looks rosy, as car makers have obtained an increased number of patents year-over-year.  Toyota’s issued patents went up 41% from 2015 to 2018, and Ford, Hyundai, BMW and Mazda all experienced increases of more than 75% in the same period of time.

For more detailed information about this technology area, or any other data related to the 2019 Patent 300™ Report, please visit harrityllp.com/patent300/ or contact Rocky Berndsen directly via email at rberndsen@harrityllp.com.

Top 20 Electrical Circuits and Systems Companies patent 300 2019

Electrical Circuits and Systems Ranks as the #2 Technology Area in the 2019 Patent 300™ Report

By Rocky Berndsen

The 2019 Patent 300™ Report details the top 300 companies, organizations, and universities obtaining patents in the United States.  Data from the report shows that nearly 70% of the U.S. patents obtained in 2018 were for electrical, software, or computer-related technologies.  The top 10 technology areas, which represent 49% of the 167,164 U.S. patents obtained by Patent 300 companies in 2018, are dominated by electrical technologies.

Chart 1 shows the Electrical Circuits and Systems technology area ranked 2rd largest in 2018.  There were 13,215 patents issued for Patent 300 companies in the U.S.  Electrical Circuits and Systems technology covers multiple United States Patent & Trademark Office (USPTO) technology classifications.

Included are electrical systems and devices, covering a broad spectrum of electrical and electromagnetic systems, devices, and circuitry, as well as electrical connectors.

Chart 1 – Top 10 Technology Areas for Patent 300 (2018 U.S. Patents)

RankPatent 300 Technology Area2018 U.S. PatentsPercentage of Total 2018 U.S. Patents
1Semiconductors/Memory15,1539%
2Electrical Circuits and Systems13,2158%
3Multiplex and VoIP9,8756%
4Optics9,0035%
5Printing/Measuring and Testing8,6415%
6Thermal & Combustion Technology, Motive & Fluid Power Systems7,0174%
7Selective Visual Display Systems4,8553%
8Telecommunications: Analog Radio Telephone; Satellite and Power Control; Transceivers, Measuring and Testing; Bluetooth; Receivers and Transmitters; Equipment Details4,7613%
9Computer Networks4,5443%
10Cryptography and Security4,3113%

The top 20 companies in the Electrical Circuits and Systems area, shown in Chart 2.  They include Murata (#1), Samsung (#2), Mitsubishi Electric (#3), GE (#4), and others.  Murata tops the list having obtained 458 U.S. patents, up 6% from 2017.  Samsung had 456 U.S. patents, down 11% from 2017.  Mitsubishi Electric, at 337, was down 4% from 2017.  The top 20 companies represent a cross-section of the technology sector.  Included are device makers, chip makers, and auto makers, and various manufacturing companies.

Chart 2 – Top 20 Companies by U.S. Patents in Electrical Circuits and Systems

Patent 300 Company NamePatent 300 RankPatents 2018Percentage of 2018 PatentsPatents 2017Change from 2017 Patents
Murata Manufacturing145861%4326%
Samsung24566%507-11%
Mitsubishi Electric333728%349-4%
GE428511%334-17%
Intel52838%333-18%
Panasonic628015%356-27%
Apple Inc.727813%24612%
IBM82493%2394%
Toyota924610%20019%
Yazaki1023873%272-14%
Sumitomo Electric1122647%248-10%
Denso1222619%273-21%
Infineon1322125%266-20%
Samsung Electro-mechanics1421465%17817%
Qualcomm152139%246-15%
Texas Instruments1621127%239-13%
Siemens1720915%231-11%
TE Connectivity1820867%246-18%
Toshiba1919612%15222%
Hon Hai2018839%296-57%

For more detailed information about this technology area, or any other data related to the 2019 Patent 300™ Report, please visit harrityllp.com/patent300/ or contact Rocky Berndsen directly via email at rberndsen@harrityllp.com.

Multiplex and VoIP - Top 20

Multiplex and VoIP Ranks as the #3 Technology Area in the 2019 Patent 300 Report

By Rocky Berndsen

The 2019 Patent 300™ Report details the top 300 companies, organizations, and universities obtaining patents in the United States.  Data from the report shows that nearly 70% of the U.S. patents obtained in 2018 were for electrical, software, or computer-related technologies.  The top 10 technology areas, which represent 49% of the 167,164 U.S. patents obtained by Patent 300 companies in 2018, are dominated by electrical technologies.

Chart 1 shows the Multiplex and VoIP technology area ranked 3rd largest in 2018, where 9,875 patents were issued for Patent 300 companies in the U.S.  Multiplex and VoIP technology covers United States Patent & Trademark Office (USPTO) technology classifications related to simultaneous transmission of two or more information signals in either or both directions over the same transmission medium.  Transmission in this manner allows discrete recovery of information signals.

Chart 1 – Top 10 Technology Areas for Patent 300 (2018 U.S. Patents)

RankPatent 300 Technology Area2018 U.S. PatentsPercentage of Total 2018 U.S. Patents
1Semiconductors/Memory15,1539%
2Electrical Circuits and Systems13,2158%
3Multiplex and VoIP9,8756%
4Optics9,0035%
5Printing/Measuring and Testing8,6415%
6Thermal & Combustion Technology, Motive & Fluid Power Systems7,0174%
7Selective Visual Display Systems4,8553%
8Telecommunications: Analog Radio Telephone; Satellite and Power Control; Transceivers, Measuring and Testing; Bluetooth; Receivers and Transmitters; Equipment Details4,7613%
9Computer Networks4,5443%
10Cryptography and Security4,3113%

The top 20 companies in the Multiplex and VoIP area, shown in Chart 2, are large global technology companies.  They include LG Electronics (#1), Huawei (#2), Ericsson (#3), Qualcomm (#4), and others.  Despite a 19% decrease from 2017, LG Electronics tops the list having obtained 894 U.S. patents. Huawei had a 17% increase over 2017 at 882 U.S. patents.  Ericsson, at 747, was down 5% from 2017. The top 20 companies represent a cross-section of the technology sector.  Included are device makers, chip makers, and telecommunications companies.

Chart 2 – Top 20 Companies by U.S. Patents in Multiplex and VoIP

Patent 300 Company NamePatent 300 Rank in Multiplex and VoIPMultiplex and VoIP Patents 2018% of Company's 2018 U.S. PatentsMultiplex and VoIP Patents 2017Change from 2017 Patents
LG Electronics189436%1060-19%
Huawei288240%73217%
Ericsson374754%784-5%
Qualcomm471930%7003%
Samsung56118%5746%
Intel654216%5243%
Cisco730435%400-32%
Nokia830334%350-16%
AT&T924019%21212%
Softbank1021231%17816%
Sony112019%14926%
IBM121932%214-11%
Apple131879%1832%
ZTE1418138%212-17%
NEC1517922%215-20%
Fujitsu1617313%243-40%
Dell171638%14014%
Interdigital1815842%185-17%
ETRI1913626%10523%
Broadcom2013439%147-10%

For more detailed information about this technology area, or any other data related to the 2019 Patent 300™ Report, please visit harrityllp.com/patent300/ or contact Rocky Berndsen directly via email at rberndsen@harrityllp.com.

Optics Ranks as the #4 Technology Area in the 2019 Patent 300™ Report

By Rocky Berndsen

The 2019 Patent 300™ Report details the top 300 companies, organizations, and universities obtaining patents in the United States.  Data from the report shows that nearly 70% of the U.S. patents obtained in 2018 were for electrical, software, or computer-related technologies.  The top 10 technology areas, which represent 49% of the 167,164 U.S. patents obtained by Patent 300 companies in 2018, are dominated by electrical technologies.

Chart 1 shows the Optics technology area ranked the 4th largest in 2018.  There were 9,003 patents issued for Patent 300 companies in the U.S.  Optics covers the United States Patent & Trademark Office (USPTO) technology classifications for apparatus and corresponding processes used for storing and retrieving optical or magneto-optical information.  The basis of the technology is relative movement between an optical storage carrier or medium and a transducer along a continuous path.

The class includes apparatus and corresponding processes for making copies or editing optical records, falling within the above definition.  It includes the transfer medium having a specific information storage structure.  The scope of the Optics technology class overlaps with other classes and subclasses.  It is an integral part of the class of patents covering Dynamic Information Storage or Retrieval.

Chart 1 – Top 10 Technology Areas for Patent 300 (2018 U.S. Patents)

RankPatent 300 Technology Area2018 U.S. PatentsPercentage of Total 2018 U.S. Patents
1Semiconductors/Memory15,1539%
2Electrical Circuits and Systems13,2158%
3Multiplex and VoIP9,8756%
4Optics9,0035%
5Printing/Measuring and Testing8,6415%
6Thermal & Combustion Technology, Motive & Fluid Power Systems7,0174%
7Selective Visual Display Systems4,8553%
8Telecommunications: Analog Radio Telephone; Satellite and Power Control; Transceivers, Measuring and Testing; Bluetooth; Receivers and Transmitters; Equipment Details4,7613%
9Computer Networks4,5443%
10Cryptography and Security4,3113%

The top 20 companies in the Optics area, shown in Chart 2, are large global technology companies.  They include Samsung (#1), Canon (#2), BOE Technology (#3), TCL Corporation (#4), and others.  Samsung tops the list having obtained 672 U.S. patents, down from 2017.  Canon had 366 U.S. patents.  BOE Technology, at 326, was up 8% from 2017.  The top 20 companies represent a cross-section of the technology sector.

Chart 2 – Top 20 Companies by U.S. Patents in Telecommunications

Patent 300 Company NamePatent 300 Rank in OpticsOptics Patents 2018% of Company's 2018 U.S. PatentsOptics Patents 2017Change from 2017 Patents
Samsung16728%769-14%
Canon236610%426-16%
BOE332620%3018%
TCL424826%19322%
Carl Zeiss524667%255-4%
ASML621686%1998%
Philips721316%224-5%
Panasonic820111%14130%
Japan Display919832%212-7%
Seiko Epson1018414%203-10%
GE111536%1437%
Nikon1215063%13013%
Fujifilm1314712%186-27%
Toshiba141398%7149%
Corning1513728%160-17%
IBM161251%1232%
Hitachi171249%175-41%
Sony181226%164-34%
Olympus1912018%10215%
LG Display2011817%1079%

For more detailed information about this technology area, or any other data related to the 2019 Patent 300™ Report, please visit harrityllp.com/patent300/ or contact Rocky Berndsen directly via email at rberndsen@harrityllp.com.

Printing or Measuring and Testing Ranks as the #5 Technology Area in the 2019 Patent 300™ Report

By Rocky Berndsen

The 2019 Patent 300™ Report details the top 300 companies, organizations, and universities obtaining patents in the United States.  Data from the report shows that nearly 70% of the U.S. patents obtained in 2018 were for electrical, software, or computer-related technologies.  The top 10 technology areas, which represent 49% of the 167,164 U.S. patents obtained by Patent 300 companies in 2018, are dominated by electrical technologies.

Chart 1 shows the Printing or Measuring, and Testing technology area ranked 5th largest in 2018.  There were 8,641 patents issued for Patent 300 companies in the U.S.  Printing or Measuring and Testing cover United States Patent & Trademark Office (USPTO) technology classifications related to Printing and Measuring Technology, respectively.

Printing patents include means adapted to produce characters or designs on surfaces by the impression of types or dies.  Also included is applying coating material through the openings of a covering pattern sheet, such as stenciling. Printing patents also cover impression from graphic or intaglio surfaces.  These patents include organizations using a design or character dies that emboss, burn, or perforate, and that apply ink.

Measuring and Testing is the generic class for processes and apparatus for measuring of any kind or for any testing.  It includes all subjects not provided for in other classes.  The term “test” includes inspection, processes, and apparatus for examination or review not covered by other classes.  This class is the generic class for sampling and consists of all sampling apparatus and processes not otherwise classified.

Chart 1 – Top 10 Technology Areas for Patent 300 (2018 U.S. Patents)

RankPatent 300 Technology Area2018 U.S. PatentsPercentage of Total 2018 U.S. Patents
1Semiconductors/Memory15,1539%
2Electrical Circuits and Systems13,2158%
3Multiplex and VoIP9,8756%
4Optics9,0035%
5Printing/Measuring and Testing8,6415%
6Thermal & Combustion Technology, Motive & Fluid Power Systems7,0174%
7Selective Visual Display Systems4,8553%
8Telecommunications: Analog Radio Telephone; Satellite and Power Control; Transceivers, Measuring and Testing; Bluetooth; Receivers and Transmitters; Equipment Details4,7613%
9Computer Networks4,5443%
10Cryptography and Security4,3113%

The top 20 companies in the Printing or Measuring and Testing area, shown in Chart 2, are large global technology companies.  They include Canon (#1), Seiko Epson (#2), Brother (#3), HP (#4), and others.  Canon tops the list having obtained 843 U.S. patents, up 8% from 2017.  Seiko Epson had 496 U.S. patents. Brother Industries, at 353, was down 1% from 2017.  The top 20 companies represent a cross-section of the technology sector.  Included are device makers and software producers, auto makers, and electronics companies.

Chart 2 – Top 20 Companies by U.S. Patents in Telecommunications

Patent 300 Company NamePatent 300 RankPatents 2018Percentage of 2018 PatentsPatents 2017Change from 2017 Patents
Canon184324%7728%
Seiko Epson249639%536-8%
Brother335358%357-1%
HP431042%22627%
Ricoh529228%325-11%
Kyocera627326%22617%
Siemens726619%2487%
Toshiba826316%16836%
IBM92393%251-5%
GE102128%234-10%
Fujifilm1119316%248-28%
Samsung121872%1775%
Konica Minolta1317426%13522%
Robert Bosch1416513%176-7%
Halliburton1512414%11110%
Hitachi161149%151-32%
Toyota171104%1064%
Panasonic181096%999%
Denso191059%8321%
Taiwan Semi20974%111-14%

For more detailed information about this technology area, or any other data related to the 2019 Patent 300™ Report, please visit harrityllp.com/patent300/ or contact Rocky Berndsen directly via email at rberndsen@harrityllp.com.

Thermal & Combustion Technology, Motive & Fluid Power Systems Ranks as the #6 Technology Area in the 2019 Patent 300™ Report

By Rocky Berndsen

The 2019 Patent 300™ Report details the top 300 companies, organizations, and universities obtaining patents in the United States.  Data from the report shows that nearly 70% of the U.S. patents obtained in 2018 were for electrical, software, or computer-related technologies.  The top 10 technology areas, which represent 49% of the 167,164 U.S. patents obtained by Patent 300 companies in 2018, are dominated by electrical technologies.

Chart 1 shows the Thermal & Combustion Technology, Motive & Fluid Power Systems technology ranked 6th largest in 2018.  There were 7,017 patents issued for Patent 300 companies in the U.S. Thermal & Combustion Technology, Motive & Fluid Power Systems covers several United States Patent & Trademark Office (USPTO) technology classifications.  Motive Power Systems are systems of electrical supply and/or of control for one or more electric motors.  Electrical Systems and Devices, Power Supply or Regulation Systems, Electrothermally or Thermally Actuated Switches, are among the many possible classifications related to this technology area.

Chart 1 – Top 10 Technology Areas for Patent 300 (2018 U.S. Patents)

RankPatent 300 Technology Area2018 U.S. PatentsPercentage of Total 2018 U.S. Patents
1Semiconductors/Memory15,1539%
2Electrical Circuits and Systems13,2158%
3Multiplex and VoIP9,8756%
4Optics9,0035%
5Printing/Measuring and Testing8,6415%
6Thermal & Combustion Technology, Motive & Fluid Power Systems7,0174%
7Selective Visual Display Systems4,8553%
8Telecommunications: Analog Radio Telephone; Satellite and Power Control; Transceivers, Measuring and Testing; Bluetooth; Receivers and Transmitters; Equipment Details4,7613%
9Computer Networks4,5443%
10Cryptography and Security4,3113%

The top 20 companies in the Thermal & Combustion Technology, Motive & Fluid Power Systems area are shown in Chart 2. They include UTX (#1), GE (#2), Ford (#3), Toyota (#4), and others.  United Technologies Corporation tops the list having obtained 906 U.S. patents, up 46% from 2017.  General Electric had a 6% increase over 2017 at 574 U.S. patents.  Ford, at 462, was down 4% from 2017.  The top 20 companies represent a cross-section of the manufacturing, transportation, and technology sectors. Included are automakers and supporting companies, tech companies, and other manufacturers.

Chart 2 – Top 20 Companies by U.S. Patents in Thermal & Combustion Technology, Motive & Fluid Power Systems

Patent 300 Company NamePatent 300 Rank in Thermal & Combustion Technology, Motive & Fluid Power SystemsThermal & Combustion Technology, Motive & Fluid Power Systems Patents 2018% of Company's 2018 U.S. PatentsThermal & Combustion Technology, Motive & Fluid Power Systems Patents 2017Change from 2017 Patents
UTX190642%49246%
GE257422%5376%
Ford346221%482-4%
Toyota440716%3816%
Hyundai525116%19722%
GM622619%2184%
Safran722444%16128%
Rolls-Royce821655%18415%
Denso921518%17817%
Siemens1018513%1765%
Mitsubishi Electric1117515%191-9%
Robert Bosch1217113%176-3%
LG Electronics131436%148-3%
Caterpillar1414028%192-37%
Mitsubishi Heavy1513841%161-17%
Honeywell.16999%104-5%
Continental179623%105-9%
Mahle189158%113-24%
Borgwarner199146%883%
Honda20879%808%

For more detailed information about this technology area, or any other data related to the 2019 Patent 300™ Report, please visit harrityllp.com/patent300/ or contact Rocky Berndsen directly via email at rberndsen@harrityllp.com.

Selective Visual Display Systems Ranks as the #7 Technology Area in the 2019 Patent 300™ Report

By Rocky Berndsen

The 2019 Patent 300™ Report details the top 300 companies, organizations, and universities obtaining patents in the United States.  Data from the report shows that nearly 70% of the U.S. patents obtained in 2018 were for electrical, software, or computer-related technologies.  The top 10 technology areas, which represent 49% of the 167,164 U.S. patents obtained by Patent 300 companies in 2018, are dominated by electrical technologies.

Chart 1 shows the Selective Visual Display Systems technology area ranked 7th largest in 2018.  Selective Visual Display Systems covers United States Patent & Trademark Office (USPTO) technology classifications related to processes and apparatus for selective, electrical control of two or more light-generating or light-controlling display elements. Processes and devices under these classifications use received or stored image data signal. The image data includes character, graphical information, or display attribute data.  Image data sources may consist of peripheral input devices, television signals, image data recognition, or computers.

This class also includes digital data processing systems or methods for visual presentation.  Data processing consists of the creation or manipulation of graphic objects (e.g., artificial images), or text.  The class includes telegraphy subclasses for digitizing writing tablets, styluses, and circuits.

Chart 1 – Top 10 Technology Areas for Patent 300 (2018 U.S. Patents)

RankPatent 300 Technology Area2018 U.S. PatentsPercentage of Total 2018 U.S. Patents
1Semiconductors/Memory15,1539%
2Electrical Circuits and Systems13,2158%
3Multiplex and VoIP9,8756%
4Optics9,0035%
5Printing/Measuring and Testing8,6415%
6Thermal & Combustion Technology, Motive & Fluid Power Systems7,0174%
7Selective Visual Display Systems4,8553%
8Telecommunications: Analog Radio Telephone; Satellite and Power Control; Transceivers, Measuring and Testing; Bluetooth; Receivers and Transmitters; Equipment Details4,7613%
9Computer Networks4,5443%
10Cryptography and Security4,3113%

The top 20 companies in the Selective Visual Display Systems area, shown in Chart 2, are large global technology companies. Selective Visual Display Systems is an important technology area in the patent world with over 4,855 US patents in 2018 alone.  They include Samsung (#1), BOE Technology Group (#2), TCL (#3), Apple (#4), and others.  Samsung tops the list having obtained 909 US patents, up slightly from 2017.  BOE Technology had a 20% increase from 2017 at 481 US patents.  TCL, at 308, was up 28% from 2017. The top 20 companies represent a cross-section of the technology sector.  Included are device manufacturers, software, and media companies.

Chart 2 – Top 20 Companies by U.S. Patents in Selective Visual Display Systems

Patent 300 Company NamePatent 300 Rank in Selective Visual Display SystemsSelective Visual Display Systems Patents 2018% of Company’s 2018 U.S. PatentsSelective Visual Display Systems Patents 2017Change from 2017 Patents
Samsung190911%9011%
BOE248129%38720%
TCL330832%22328%
Apple425812%20421%
LG Display524136%20415%
Japan Display621535%18713%
Sony71849%1783%
Microsoft81546%12718%
Synaptics911659%119-3%
Seiko Epson10967%7918%
Semiconductor Energy Lab119411%940%
LG Electronics12924%113-23%
Sharp138913%111-25%
Panasonic14804%4642%
IBM15801%5235%
Lenovo167813%90-15%
Alphabet17703%657%
Microchip Technology186534%4235%
Intel19592%4819%
Immersion205841%3933%

For more detailed information about this technology area, or any other data related to the 2019 Patent 300™ Report, please visit harrityllp.com/patent300/ or contact Rocky Berndsen directly via email at rberndsen@harrityllp.com.

Telecommunications Top 20 Patent 300 2019

Telecommunications Ranks as the #8 Technology Area in the 2019 Patent 300™ Report

By Rocky Berndsen

The 2019 Patent 300™ Report details the top 300 companies, organizations, and universities obtaining patents in the United States.  Data from the report shows that nearly 70% of the U.S. patents obtained in 2018 were for electrical, software, or computer-related technologies.  The top 10 technology areas, which represent 49% of the 167,164 U.S. patents obtained by Patent 300 companies in 2018, are dominated by electrical technologies.

As is shown in Chart 1, the Telecommunications technology area is the 8th largest technology area in 2018 with 4,761 patents issued for Patent 300 companies in the U.S.  The Telecommunications technology area covers United States Patent & Trademark Office (USPTO) technology classifications related to communications systems in which electric or electromagnetic signals are used to transmit modulated carrier wave information between points.  The transmission media is via radio wave generally of a frequency above human speech, yet at a frequency lower than infrared frequencies. Radiotelephonic communication via wireless link is included in this class.

Chart 1 – Top 10 Technology Areas for Patent 300 (2018 U.S. Patents)

RankPatent 300 Technology Area2018 U.S. PatentsPercentage of Total 2018 U.S. Patents
1Semiconductors/Memory15,1539%
2Electrical Circuits and Systems13,2158%
3Multiplex and VoIP9,8756%
4Optics9,0035%
5Printing/Measuring and Testing8,6415%
6Thermal & Combustion Technology, Motive & Fluid Power Systems7,0174%
7Selective Visual Display Systems4,8553%
8Telecommunications: Analog Radio Telephone; Satellite and Power Control; Transceivers, Measuring and Testing; Bluetooth; Receivers and Transmitters; Equipment Details4,7613%
9Computer Networks4,5443%
10Cryptography and Security4,3113%

The top 20 companies in the Telecommunications area, shown in Chart 2, are large global technology companies.  They include Samsung (#1), Huawei (#2), Qualcomm (#3), LG (#4) and others.  Samsung tops the list having obtained 408 US patents, down slightly from 2017.  Huawei had a 23% increase over 2017 at 284 US patents. Qualcomm, at 277, was down 38% from 2017.  The top 20 companies represent a cross section of the technology sector.  Included are device manufacturers, wireless carriers, and media companies.

Chart 2 – Top 20 Companies by U.S. Patents in Telecommunications

Patent 300 Company NamePatent 300 Rank in TelecomTelecom Patents 2018% of Company’s 2018 U.S. PatentsTelecom Patents 2017Change from 2017 Patents
Samsung14085%412-1%
Huawei228413%21823%
Qualcomm327712%382-38%
LG Electronics42309%2166%
AT&T522017%2143%
Ericsson620615%282-37%
Intel71835%225-23%
Apple81828%224-23%
IBM91672%198-19%
Sony101155%138-20%
Nokia1110812%193-79%
Softbank1210315%106-3%
Microsoft13974%934%
Verizon149515%125-32%
Alphabet Inc.15924%113-23%
Skyworks167938%5827%
Deutsche Telekom177442%714%
Blackberry187220%108-50%
ZTE196714%81-21%
NEC20658%88-35%

For more detailed information about this technology area, or any other data related to the 2019 Patent 300™ Report, please visit harrityllp.com/patent300/ or contact Rocky Berndsen directly via email at rberndsen@harrityllp.com.