Comparing Auto Manufacturer’s Patent Data to Sales, Revenues, and R&D

By Rocky Berndsen, Head of Harrity Patent Analytics


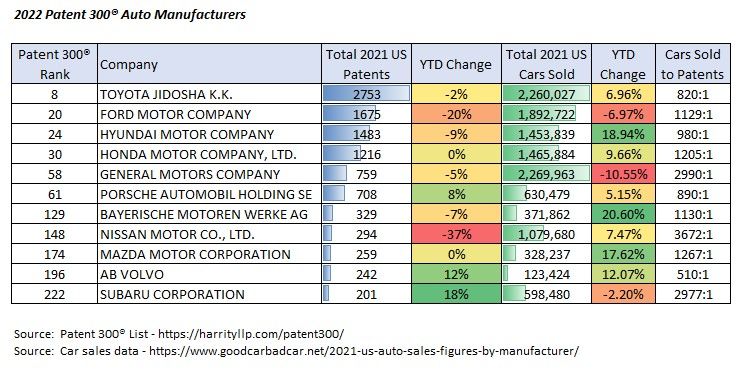
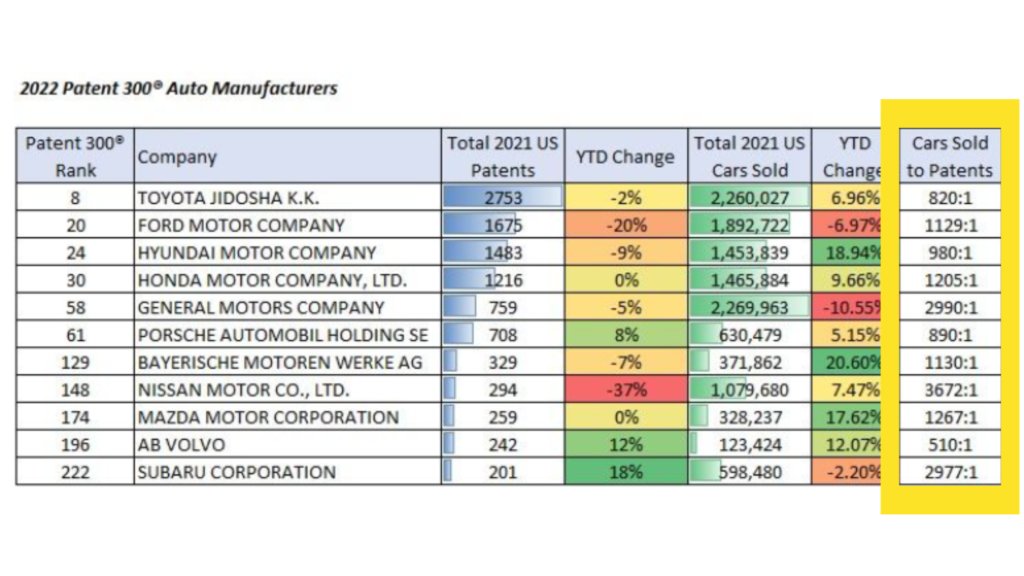
One of my favorite ways to look at patent data is by comparing the data to sales, revenues, and R&D. Here are the top Auto Manufacturers that obtained patents in the US. I’ve included data from our patent database, and from www.goodcarbadcar.com.

This stat is interesting – Cars Sold to Patents. There could be a couple of insights drawn from this stat.

Here are some of my thoughts:
1. How much does a company value patenting – a higher ratio may indicate that the company places less value on patenting.
2. How much are patents playing in driving sales – a lower ratio may indicate that patents play a bigger role in driving sales
3. Which companies are innovating the most in the space relative to market size – using cars sold to normalize the quantity of patents provides a more direct benchmark.

Connect with me on Linkedin and let me know your thoughts on this statistic and what other kinds of stats you’d find interesting.

You can find more patent data on the top companies by viewing our Patent 300® List HERE.


About Harrity Patent Analytics

Harrity Patent Analytics, an analytical team within the boutique IP law firm of Harrity & Harrity, LLP, uses cutting-edge capabilities to analyze patent data and extract insights for clients to use when making strategic decisions regarding patent portfolios. Patent 300® companies rely on Harrity Patent Analytics services to understand their patent portfolios, the patent portfolios of their competitors, and patent office trends around the world. For more information, visit harrityllp.com/services/patent-analytics/.

 

Harrity Analytics Announces Top Patent Firms of 2021

HARRITY PATENT ANALYTICS ANNOUNCES THE TOP PATENT FIRMS OF 2021

WASHINGTON (January 20, 2022) –  Harrity Patent Analytics is excited to announce the Top Patent Firms of 2021. The list, published annually, ranks industry-leading patent law firms based on the total number of U.S. utility patents issued in the past year.

The 2021 Top Patent Firms list incorporates multiple categories of prosecution statistics, including 7 new categories, such as rank in US First Filings and rank in Foreign Priority Filings.

Fish & Richardson surpasses Oblon for the first time in list history, taking the #1 spot in both overall and US first filings. Other notable changes on the list include Kilpatrick Townsend dropping from the #7 spot to #11, and Foley & Lardner moving up from #8 to #5.  Some newcomers to the list in 2021 include Kacvinsky Daisak Bluni at #109, and Fig. 1 Patents at #282.

The Top 10 firms of 2021 in overall utility patents are:

  1. Fish & Richardson P.C. (5025)
  2. Oblon McClelland Maier & Neustadt LLP (4620)
  3. Sughrue Mion PLC (4398)
  4. Cantor Colburn LLP (3652)
  5. Foley & Lardner LLP (3416)
  6. Oliff PLC (3297)
  7. Birch Stewart Kolach & Birch LLP (3250)
  8. Knobbe Martens Olson & Bear LLP (3014)
  9. Shwegman Lundberg & Woessner P.A. (2995)
  10. Harness Dickey & Pierce PLC (2963)


“The differences on this year’s Top Patent Firm rankings align with what we saw on the Patent 300®, with big companies filing less patents than in previous years, and therefore the law firms doing their work obtaining less patents – likely due to budgetary restraints imposed by the ongoing pandemic. The list demonstrates which patent firms are still big players, while providing insight for both clients and firms to make strategic decisions moving forward,” states Rocky Berndsen, Head of Harrity Patent Analytics.

The Top Patent Firms list is accompanied by an interactive dashboard and includes patent firms that have obtained at least 50 U.S. utility patents where the patent firms are listed on the front of the utility patents. Company legal departments have not been eliminated from the list.  The full list is available here.

About Harrity Patent Analytics

Harrity Patent Analytics, an analytical team within the boutique IP law firm of Harrity & Harrity, LLP, uses cutting-edge capabilities to analyze patent data and extract insights for clients to use when making strategic decisions regarding patent portfolios. Patent 300® companies rely on Harrity Patent Analytics services to understand their patent portfolios, the patent portfolios of their competitors, and patent office trends around the world. For more information, visit harrityllp.com/services/patent-analytics/.
###

Harrity Analytics Releases 2022 Design Patent 100 List

HARRITY PATENT ANALYTICS RELEASES THE 2022 DESIGN PATENT 100 LIST

List ranks top 100 companies, organizations, and universities in the design patent field

WASHINGTON (January 11, 2022) – Harrity Patent Analytics has released the 2022 publication of its annual Design Patent 100 List.  The list ranks the top 100 companies, organizations and universities in the patent field based on the total number of U.S. design patents issued in the past year.  The top 10 innovators from the 2022 Design Patent 100 List include:

  1. Samsung (615)
  2. Nike (541)
  3. Apple (438)
  4. LG (220)
  5. Ford (210)
  6. Alphabet (209)
  7. MASCO Corporation (194)
  8. Tata Sons (159)
  9. Porsche (152)
  10. P&G (141)

Samsung Electronics surpassed Nike to take the #1 spot, with a 4% increase from last year. Nike dropped to the #2 position with a 22% decrease from last year.  Overall, this year’s Top 10 saw an average 1% decrease from the previous year.  Other notable changes include MASCO Corporation’s debut to the Top 10, ranking 7th with a 59% increase, and Spigen Inc, dropping off the Top 10 to #12, with a 46% decrease. Bissell Homecare had the largest increase in design patents since 2020, at 1500%.

“The Design Patent 100 List identifies the global innovation leaders obtaining design patents in the United States,” said Rocky Berndsen, Head of Analytics for Harrity & Harrity. “The data contained in the Patent 300® Dashboard, such as the Design Patent 100 List, provides invaluable information to companies, in-house counsel, marketing teams, and law firms alike because it identifies the key players in design innovation and summarizes what is happening today in the patent world.”

For detailed analytics on the Design Patent 100, visit Harrity’s Patent 300® Dashboard, the intellectual property industry’s premier resource for patent insights and competitive intelligence on the world’s leaders in technology and design innovation.  The Dashboard contains analytics on more than 6,000,000 patents, including patent portfolio analyses, detailed patent prosecution insights, technology area breakdowns, and portfolio cost and budget analytics.

About Harrity Patent Analytics

Harrity Patent Analytics, an analytical team within the boutique IP law firm of Harrity & Harrity, LLP, uses cutting-edge capabilities to analyze patent data and extract insights for clients to use when making strategic decisions regarding patent portfolios. Patent 300® companies rely on Harrity Patent Analytics services to understand their patent portfolios, the patent portfolios of their competitors, and patent office trends around the world. For more information, visit harrityllp.com/services/patent-analytics/.
###

Elaine Spector appointed as 2022 Vice Chair of IPO’s Diversity & Inclusion Committee

We are proud to announce that Harrity Partner, Elaine Spector, has been appointed to serve as Vice Chair of IPO’s Diversity & Inclusion Committee for 2022!
On her role, Elaine said, “I am honored to continue my role as Vice-Chair of the Intellectual Property Owner Association (IPO)’s Diversity & Inclusion Committee for 2022. We have an amazing team of leaders on this committee, and I am excited for the year ahead and all that we will accomplish. There is still so much work to be done in this space.”
To learn more about IPO’s D&I Committee, visit their website here!


A Look at Patent 300® Companies’ Office Actions Per Patent

HARRITY PATENT ANALYTICS: A LOOK AT PATENT 300® COMPANIES’ OFFICE ACTIONS PER PATENT

By Rocky Berndsen, Head of Harrity Analytics

One of the stats I find most interesting in the patent field is the office action per patent statistic. There can be so many reasons why this statistic could vary so greatly from company to company. Here are a few of my ideas on the factors that go into it.

1. Filing strategy / Claim breadth – some filers will fight tooth and nail for every claim, whereas, other filers are just trying to get to allowance as quickly as possible.

2. Technology area – some technology areas may be more difficult to get patents in for a number of reasons (e.g., quality prior art, large numbers of filings, patentability issues).

3. Prosecution quality – the quality of prosecution quality varies from firm to firm, and even from attorney to attorney.

4. Foreign priority – apps with foreign priority tend to have fewer office actions per patent and typically will have fewer claims.

5. Budget/Cost consideration – prosecution strategy may be impacted by budget and therefore applications that reach higher numbers of office actions or RCEs may be abandoned.

6. Continuation strategy – continuation filings will tend to have fewer office actions than original priority filings.

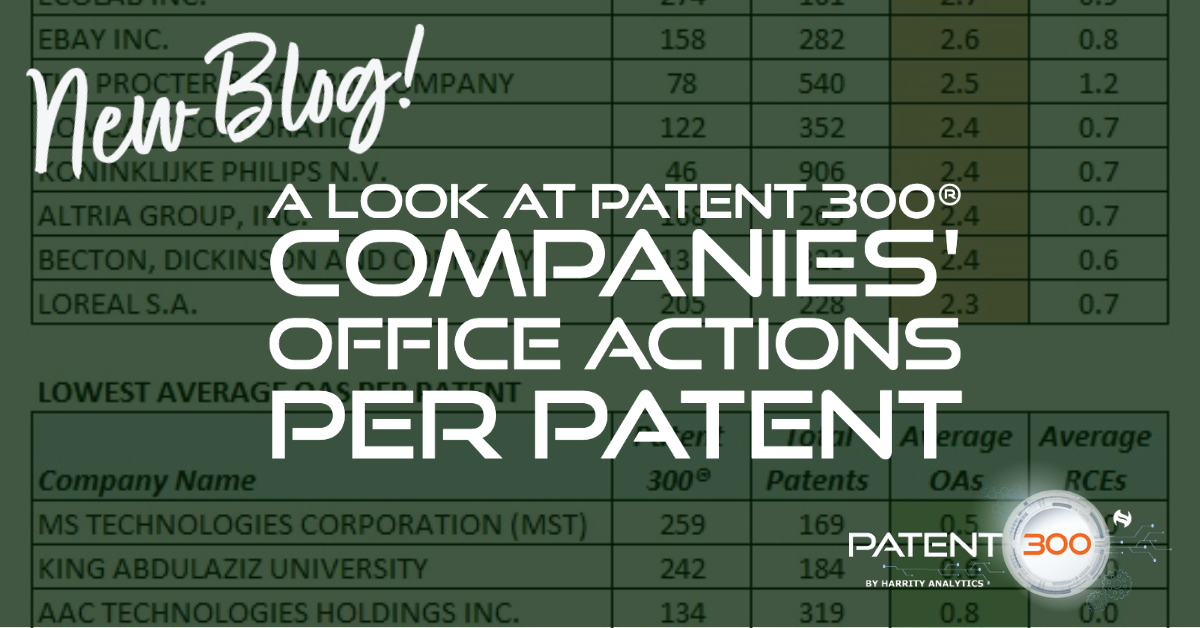
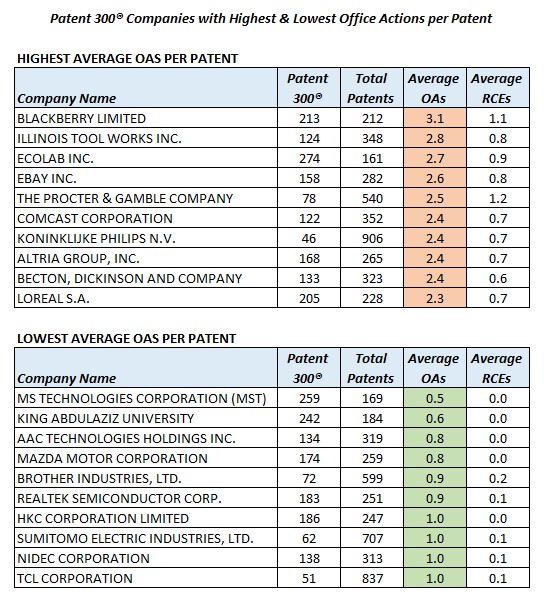
Below, you can see the Patent 300® Companies with the highest and lowest office actions per patent.

I’d love to hear if you have any additional thoughts on the factors that go into these OA statistics.

The official 2022 ranking of the top 300 companies, organizations and universities can be found here. You can find more information regarding prosecution statistics in the interactive Patent 300® Dashboard here.


About Harrity Patent Analytics

Harrity Patent Analytics, an analytical team within the boutique IP law firm of Harrity & Harrity, LLP, uses cutting-edge capabilities to analyze patent data and extract insights for clients to use when making strategic decisions regarding patent portfolios. Patent 300® companies rely on Harrity Patent Analytics services to understand their patent portfolios, the patent portfolios of their competitors, and patent office trends around the world. For more information, visit harrityllp.com/services/patent-analytics/.

 

Law 360: IBM, Samsung Keep Top Spots On Annual Patent 300® List

Law360 publishes report based on Harrity Analytic’s annual Patent 300® List.

Law360 (January 6, 2022, 7:42 PM EST) — IBM Corp. maintained its long-running status as the top patent owner in 2021 while Samsung clocked in close behind, but patent grants to companies that notched a spot on the list highlighting the top 300 patent owners released Thursday were largely down…

Rocky Berndsen, head of patent analytics at Harrity & Harrity, told Law360 in an interview that the drops in patent grants in 2021 can be partly attributed to budget considerations spurred by the pandemic.

“Anecdotally, what we can see from this year’s list is that some companies have been more strategic with what patent applications they continued to prosecute in light of those budget considerations,” Berndsen said. “Maybe last year, or the year before, they would’ve filed or prosecuted more applications. But they decided to drop some, and so we’re seeing the results of that in this year’s list.”

But there were some companies that landed on the list for the first time, including JPMorgan Chase & Co. at 275. Berndsen said that reflects growth happening in the fintech world.

“There’s a lot of technology development in fintech, and we’re seeing a lot of that with a company like JPMorgan Chase making the list for the first time this year,” he said.

Read the full Law360 report by Britain Eakin here.


About Harrity Patent Analytics

Harrity Patent Analytics, an analytical team within the boutique IP law firm of Harrity & Harrity, LLP, uses cutting-edge capabilities to analyze patent data and extract insights for clients to use when making strategic decisions regarding patent portfolios. Patent 300® companies rely on Harrity Patent Analytics services to understand their patent portfolios, the patent portfolios of their competitors, and patent office trends around the world. For more information, visit harrityllp.com/services/patent-analytics/.


Harrity Analytics Releases 2022 Patent 300® List

HARRITY PATENT ANALYTICS RELEASES THE 2022 PATENT 300® LIST

Top 300 innovators in the patent field ranked by patents obtained

WASHINGTON (January 6, 2022) – Harrity Patent Analytics is excited to announce the release the 2022 Patent 300® List.  The annual list ranks the top 300 companies, organizations and universities in the patent field based on the total number of U.S. utility patents issued in the past twelve months.  The top 20 players from the newly published Patent 300® List include:

  1. IBM (8540)
  2. Samsung Electronics (8517)
  3. LG Corporation (4388)
  4. Canon (3400)
  5. Huawei (2955)
  6. Intel (2835)
  7. TSMC (2807)
  8. Toyota (2753)
  9. Raytheon Technologies (2694)
  10. Sony (2624)
  11. Apple (2591)
  12. Microsoft (2453)
  13. Qualcomm (2165)
  14. BOE Technology (2141)
  15. Amazon (2110)
  16. Dell Technologies (2053)
  17. Alphabet (2015)
  18. Micron (1798)
  19. Panasonic (1715)
  20. Ford (1675)


IBM maintains the top spot in the list despite a significant drop in total patents with their spin-off of Kyndryl.  Notably, TSMC, Qualcomm, and Micron moved up the list, whereas Microsoft and Raytheon Technologies moved lower.  The biggest overall change in the list is the fact that total patents obtained by the Patent 300® was 22,358 fewer in 2021 than in 2020.  The list accounts for 54 percent of the more than 340,000 U.S. patents issued in 2021.

“The Patent 300® list, year after year, provides a barometer for the most innovative companies in the world”, says Rocky Berndsen, Head of Patent Analytics at Harrity & Harrity.  “You can really see who is innovating in dozens of different industries and also see who the up-and-coming technology companies are”.

Harrity Patent Analytics additionally offers the Patent 300® Dashboard for more detailed analytics on the Patent 300® List.  The dashboard is the intellectual property industry’s premier resource for patent insights and competitive intelligence on the world’s leaders in technology, containing analytics on more than 6,000,000 patents, including patent portfolio analyses, detailed patent prosecution insights, technology area breakdowns, and portfolio cost and budget analytics.

The Patent 300® Dashboard provides in-house counsel, law firm partners, marketing teams, and c-suite executives with a detailed analysis of the world’s technology leaders, ranging from technology giants such as IBM (ranked #1) and Samsung (ranked #2), to leading universities such as MIT (ranked #108) and Johns Hopkins University (ranked #276), to newcomers including Kyndryl (ranked #117) and Snowflake (ranked #276).

The official 2022 ranking of the top 300 companies, organizations and universities can be found here.


About Harrity Patent Analytics

Harrity Patent Analytics, an analytical team within the boutique IP law firm of Harrity & Harrity, LLP, uses cutting-edge capabilities to analyze patent data and extract insights for clients to use when making strategic decisions regarding patent portfolios. Patent 300® companies rely on Harrity Patent Analytics services to understand their patent portfolios, the patent portfolios of their competitors, and patent office trends around the world. For more information, visit harrityllp.com/services/patent-analytics/.